
|
Boletín de la Sociedad Geológica Mexicana Volumen 74, núm. 1, A091121, 2022 http://dx.doi.org/10.18268/BSGM2022v74n1a091121
|
 |
Lineament mapping in the Central High Atlas using ASTER and ASTER-GDEM data, (Morocco)
Mapeo de lineamientos en el Alto Atlas Central usando datos ASTER y ASTER-GDEM, (Marruecos)
Abdelouhed Farah1,*, Ahmed Algouti1, Abdellah Algouti1, Mohammed Ait Mlouk1, Mohammed Ifkirne1
1 Department of Geology, Geoscience Geotourism Natural Hazards and Remote Sensing Laboratory (2GRNT), University of Cadi Ayyad, Faculty of Sciences Semlalia, BP 2390, 40000, Marrakesh, Morocco.
* Corresponding author: (A. Farah) This email address is being protected from spambots. You need JavaScript enabled to view it.
How to cite this article:
Farah, A., Algouti, A., Algouti, A., Ait Mlouk, M., Ifkirne, M., 2022, Lineament mapping in the Central High Atlas using ASTER and ASTER-GDEM data (Morocco): Boletín de la Sociedad Geológica Mexicana, 74 (1), A091121. http://dx.doi.org/10.18268/BSGM2022v74n1a091121
ABSTRACT
The present work focuses on lineament mapping using new spatial remote sensing techniques in the central High Atlas (CHA) of Morocco. In this study, the automatic extraction of lineaments was based on using multispectral images type Advanced Spaceborne Thermal Emission Reflection Radiometer (ASTER, L1B) with high spatial resolution up to 15 m for the visible/near-infrared (VNIR) bands. Besides, a digital elevation model (DEM) type ASTER GDEM was used with a spatial resolution of 30 m. The satellite image was pre-processed before the automatic extraction of the lineaments using the mathematical algorithm Line Module of the PCI Geomatica software 2016. Then, multisource data, such as an extract of the Ouarzazate Alougoum geological map (1/100000) covering the entire study area and a calibrated field imaging background (source: Esri, Maxar, GeoEye, Earthstar Geographics, CNES/Airbus, DS, USDA, AeroGRID, IGN, and the GIS User Community), was used for validating the results. The extraction of the lineaments from the first principal component (PC1) image was derived from the satellite image and the DEM. These results proved that each produced map has a strong similarity in concentration and orientation with three major directions including NE-SW, E-W and ENE-WSW. We observed a high concentration of these lineaments in both the central and northern parts of the study area as well.
Keywords: Central High Atlas, Morocco, structural lineaments, remote sensing, ASTER, ASTER GDEM, GIS, automatic lineament extraction.
RESUMEN
El enfoque del presente trabajo es la utilización del mapeo de lineamientos con nuevas técnicas espaciales de sensores remotos en el Alto Atlas central (CHA) de Marruecos. En este estudio, la extracción automática de lineamientos se basó en el uso de imágenes multiespectrales tipo Advanced Spaceborne Thermal Emission Reflection Radiometer (ASTER, L1B) con alta resolución espacial de hasta 15 m para las bandas visible/infrarrojo cercano (VNIR). Además, se utilizó un modelo de elevación digital (DEM) tipo ASTER GDEM con una resolución espacial de 30 m. La imagen satelital fue pre-procesada antes de la extracción automática de los lineamientos utilizando el algoritmo matemático Line Module del software PCI Geomatica 2016. Luego, datos de múltiples fuentes, como un extracto del mapa geológico de Ouarzazate Alougoum (1/100000) que cubre todo el Se utilizó un área de estudio y un fondo de imágenes de campo calibrado (fuente: Esri, Maxar, GeoEye, Earthstar Geographics, CNES/Airbus, DS, USDA, AeroGRID, IGN y GIS User Community) para validar los resultados. La extracción de los lineamientos de la imagen del primer componente principal (PC1) se derivó de la imagen de satélite y el DEM. Estos resultados demostraron que cada mapa producido tiene una gran similitud en concentración y orientación con tres direcciones principales, que incluyen NE-SW, E-W y ENE-WSW. También observamos una alta concentración de estos lineamientos tanto en la parte central como en la norte del área de estudio.
Palabras clave: Alto Atlas Central, Marruecos, lineamientos estructurales, sensores remotos, ASTER, ASTER GDEM, SIG, extracción automática de lineamientos.
- Introduction
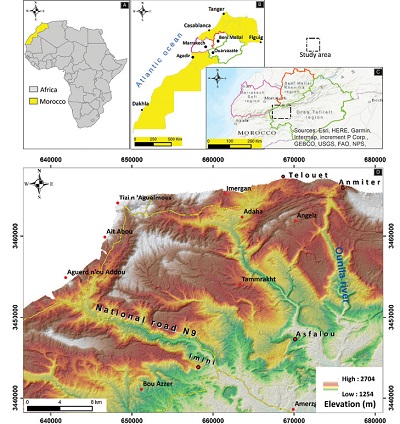
The site of the study area is situated in the Central High Atlas (CHA) of Morocco, more specifically in the district of Anmitar-Asfalou-Imini south of the High Atlas of Marrakech. This region is located at the intersection between the Variscan fold-and-thrust belt of the Anti-Atlas, the uplifted Panafrican basement of the High Atlas of Marrakech, the Neogene Siroua (or Sirwa) volcano, and the Ouarzazate basin shown in Figure 1 (Saddiqi et al., 2011). This site covers an area of 114,337 ha (Figure 1), where the coordinates of the corners are shown in Table 1.
 |
|
Figure 1. Location of the study area: (A) African view, (B) National view, (C) Regional view, and (D) 2D elevation map of the study area. |
|
Table 1. Metric coordinates of the corners of our study site. |
 |
The choice for using this region is due to several reasons such as the lack of recent literature on the application of automatic lineament extraction, the complexity and the difficulty of the high relief, and the significant extension of the area. In addition, another main reason is that the mineral potential of this area still requires an in-depth study in terms of structural geology. The study of lineaments has long been carried out in several domains of earth sciences including mining exploration, oil, geodynamics, geomorphological evolution, as well as the development of new technologies.
Numerous definitions were used to describe lineaments such as geological lineaments, tectonic lineaments, photo-lineaments, fracture traces, photo-linear, and geophysical lineaments, depending on the presumed origin of the item or sometimes the extracted data from different sources (Sander, 2007). More precisely, the lineament is a structural alignment of different dimensions. It corresponds to an accident in the Earth’s crust (usually a fault) whose influence can be felt over a long period (O’Leary, 1976; Richards, 2000). The lineament can be traced from topographical, hydrographic, geophysical information, and by photo-interpretation of aerial or satellite images. The extraction of lineaments from geospatial data can be divided at least into three approaches: (a) manual extraction (Jordan and Schott, 2005), (b) semi-automatic extraction (Jordan and Schott, 2005; Lim et al., 2001), and finally (c) automatic extraction (Abdullah et al., 2013; Thannoun, 2013). In manual and semi-automatic approaches, lineament extraction is mainly influenced and improved by in-depth interpretation. However, automatic extraction depends primarily on the performance of the used techniques along with the data provided from the used satellite images (Al-Dossary and Marfurt, 2007). These approaches have already been used in many different studies worldwide (Bonn and Rochon, 1992; Koita et al., 2010; Kouamé et al., 1999; Savané, 1997; Yesou et al., 1993). Several researchers have developed methods with different procedures for compiling lineaments (Mabee et al., 1994). Semi-automatic or fully automatic lineament extraction techniques have been proposed (Lepage, 2002), but have some limitations and require certain validation.
The typical methodology of the automatic extraction of lineaments, via the line module algorithm, is based on the processing of the visible/near-infrared (VNIR) spectral bands of the ASTER L1B and ASTER GDEM satellite image by applying efficient directional filters. These different treatments highlighted the complementarity between the results of satellite images and the digital elevation model (DEM) in the mapping of lineaments and established the lineament maps, by integrating pre-existing morphological geological data implemented in a Geographical Information System (GIS).
Therefore, a deeper understanding of lineament mapping in the region of the CHA of Morocco was investigated. In this work, the automatic extraction of lineaments was performed in order to visualize all aspects of lineaments with their statistics (numbers and frequencies of lineaments, distribution, directions, and densities). The validation of these findings was confirmed by superposition on the satellite image of the study area (Esri, Maxar, GeoEye, Earthstar Geographics, CNES/Airbus, DS, USDA, AeroGRID, IGN, and the GIS User Community), as well as on the geological map of the same area.
- Materials and Methods
2.1. GEOLOGY
The CHA of Morocco is characterized by a structural style, which refers to the presence of Triassic formations, and constitutes the detachment level (El Harfi et al., 2006). The geomorphology of the CHA is formed by the tectonic inversion of normal faults within the intercontinental basins by the alpine orogenesis (Babault et al., 2013; Teixell et al., 2003).
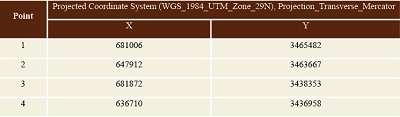
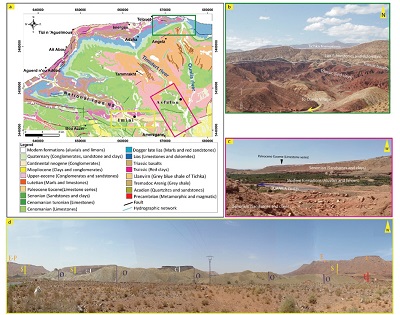
In the study area, the adjacent massifs contain igneous (mainly granites) and metamorphic rocks of the pre-Triassic age that have been deformed in earlier orogenesis. The sedimentary rocks of the Cenozoic deposited in various sedimentary environments are covered in a non-conforming manner (Ettaki, 2008). The area has only been slightly distorted from west to east. The brittle accidents that affect the cover are mainly materialized by reversed faults of the following directions: WNW-ESE (faults of Bouazzer and Assaoud) and WSW-ENE (faults of Boulgir, Tighermit, and Timkit); whereas these brittle accidents could be abrupt folds (Pouit, 1964). The topography of the region is diverse, having different elevations. The altitudes increase from the Ouarzazate basin to the southern slopes of the CHA where high peaks of the region are present (Figures 2 and 3).
 |
|
Figure 2.(A) Litho structural map extracted from the geological map of Ouarzazate Alougoum at 1/100000. (B) Panoramic view in the Anmitar district. (C) Panoramic view in the Asfalou district. (D). Panoramic view in the Imini district. (E-P: Eocene Paleocene, S: Senonian, O: Ordovician, C: Cretaceous, E: Eocene, T: Triassic). |
 |
| Figure 3. Relief representation of the study area in 3D with an exaggeration of 3 to the vertical. (A) 3D geological map, (B) DEM in 3D, and (C) topographic profile of the AB section. |
2.2.DATA
In this work, remote sensing techniques were applied to different satellite data to automatically extract the lineaments. Not only the difficult access to certain sites but also the geographical extent of the study area were the main reasons for this investigation. Furthermore, the use of conventional methods for lineament mapping cannot be efficient in the identification of all existing lineaments and the follow-up of their extension. Therefore, the extraction of automatic lineaments was carried out using multispectral bands of a satellite image from the Advanced Spaceborne Thermal Emission Reflection Radiometer (ASTER), and the ASTER-GDEM.
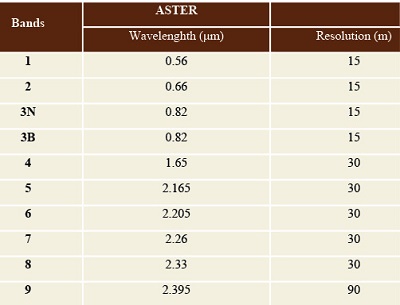
ASTER was launched in December 1999, with three spectral bands in the VNIR, six spectral bands in the short-wave infrared (SWIR), and five spectral bands in the thermal infrared (TIR) with a spatial resolution of 15 m, 30 m, and 90 m, respectively (https://asterweb.jpl.nasa.gov/) as illustrated in Table 2.
The satellite image was acquired on the 11 of March 2019 at 11:22:03.232 AM. This period is characterized by a decrease in vegetation and snow. Data were downloaded from the NASA USGS (United States Geological Survey) site: http://earthexplorer.usgs.gov and projected into the UTM (Mercator Transverse Universal Projection) coordinate system in Zone 29-North.
|
Table 2.Spectral bands of the used data. |
 |
2.3.METHODOLOGY
Several techniques are used for the extraction of lineaments and geomorphological characteristics, namely manual, semi-automatic and automatic extractions. Unlike the conventional manual and semi-automatic methods (Mallast et al., 2011), here lineament extraction was performed via the automatic technique due to its efficiency, simplicity, rapidity, and the high degree of reproducibility it offers.
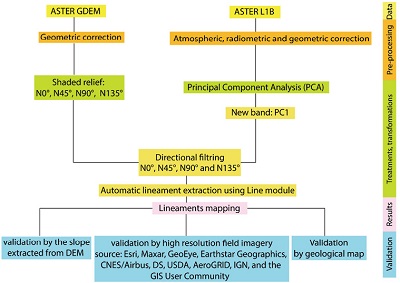
Nevertheless, the extraction of lineaments from remote sensing data requires pre-processing of the spectral bands of the ASTER satellite image, thus reducing the effect of the atmosphere and geometric distortions during data acquisition. Then, the second step is to improve the satellite image via Stretching to increase the visibility of lineaments that are not visually bounded (Abdullah et al., 2010). The main steps of automatic lineament extraction are summarized in Figure 4.
 |
|
Figure 4. Workflow of lineament automatic extraction. |
2.4.TREATMENT
2.4.1.PRINCIPAL COMPONENT ANALYSIS
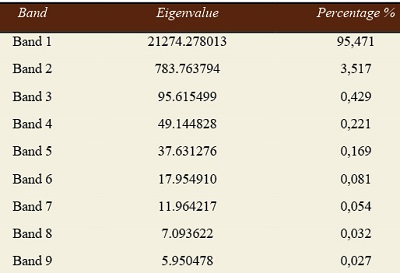
The Principal Component Analysis (PCA) is an analytical method that allows the study of a large number of variables whose total information cannot be visualized due to a space of more than three aspects (Adiri et al., 2017; Mouissi and Alayat, 2016). It is an efficient technique for accentuating a multi-spectral image for geological interpretation (Abdullah et al., 2010), generally used in lithological mapping and the extraction of lineaments. The goal of this step was to improve the image via noise reduction and better-targeted information. This method is based on the mathematical transformation of the raw image to reduce data redundancy, the resulting “neo” bands are called components and allow to reduce the information contained in five or six channels into only two or three components while keeping more than 90% of the initial information (Sedrette and Rebai, 2016). In this work, the covariance tables of the Principal Component Analysis (PCA) indicated that the information is more concentrated in PC1, (Table 3): 95.47%. The PC1 images for the ASTER image show that the boundaries of the relief are very sharp and the edges very evident (Figure 5).
|
Table 3. Results of the PCA of the used data set. |
 |
 |
|
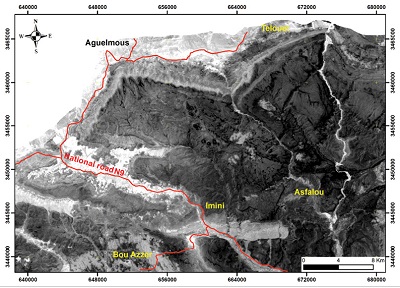
Figure 5. PC1 image from satellite ASTER. |
2.5.DIRECTIONAL FILTERS
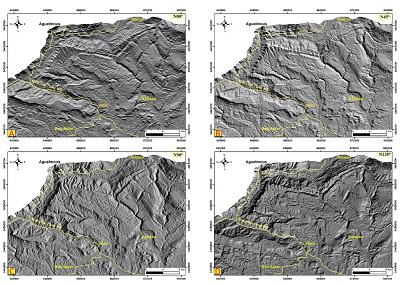
The main goal of applying directional filters was to detect any linear shape (contours, fractures, and defects) to reduce blurring and smoothness of the image. The different types of filters adopted in linearity mapping were 5×5 matrix filters in four directions (N0°, N45°, N90°, and N135°), applied to the ACP1 image. Each obtained filter allowed the detection of the different orientation systems mentioned above (Figure 6).
 |
|
Figure 6. Four subset filtered images derived from PC1 of ASTER image. |
2.6.SHADED RELIEF
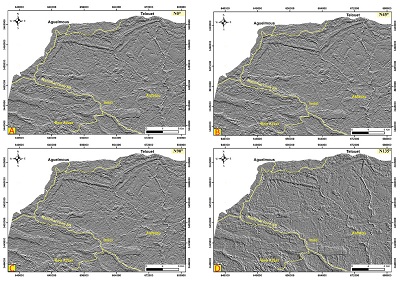
The shaded relief is frequently used for the extraction of lineaments from the DEM (Mallast et al., 2011; Martial et al., 2013). For this reason, certain parameters must be applied, namely the modification of the virtual azimuth of the sun by maintaining its elevation mark, to create a shaded relief. In addition, lineaments are extracted from the input DEM image, so that four shaded relief images are the output files with an azimuth of 0°, 45°, 90°, and 135° (Figure 7). The delineations between the shaded and unshaded areas show the existence of lineaments that need to be confirmed (Abdullah et al., 2010; El Ghrabawy et al., 2019).
 |
|
Figure 7. Four shaded relief images were derived from DEM. |
- Results and Discussion
3.1. AUTOMATIC EXTRACTION OF LINEAMENTS
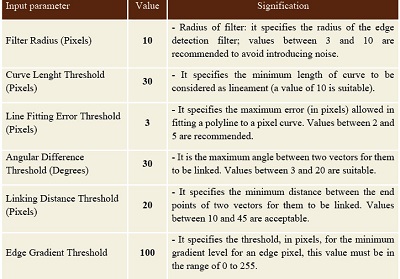
The automatic lineament extraction process was performed using the Line module algorithm of the PCI Geomatica 2016 software. Various user-defined parameters shown in Table 4 were essential during the extraction procedure (Hamdani and Baali, 2019; Hashim et al., 2013; Sedrette and Rebai, 2016). This process was applied to each of the four shaded raised images of the DEM images (N0°, N45°, N90° and N135°) and to the PCA images from the 5×5 matrix directional filters of the ENVI software.
| Table 4. Parameters controlling the automatic extraction of the LINE module. |
 |
Many detection algorithms have been used to make achievements in automatic lineament extraction on remotely sensed images (Gazi et al., 2014; Hashim et al., 2013; Saepuloh et al., 2018; Sharifi et al., 2018).
The automatic extraction of lineaments consists in using the Line tool in Geomatica software. This tool extracts linear features from the image and saves the polylines in a vector layer. The use of such features is easy and fast; moreover, it offers a high degree of reproducibility in contrast to conventional subjective manual methods (Mallast et al., 2011). However, the function has several parameters that must be adjusted simultaneously, with no way to visualize the impact of each parameter separately, as a consequence, the choice of parameters is based on the will of the photo-interpreter, which indirectly amounts to directed extraction (Kouamé et al., 1999). Indeed, the parameters for defining discontinuities in filtered images are complex and concern the length, angle and gradient level thresholds for a pixel or a set of pixels, either considered as a single linear or curvilinear feature. The extracted lineaments are converted to SHP format to be exported to ArcGis specialized in geospatial analysis and processing.
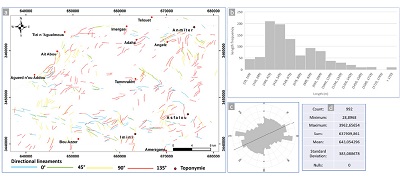
Automatic methods generate many insignificant lineaments (Singhal and Gupta, 2010). Moreover, by combining information through a GIS, previously vectored anthropogenic linearity (roads, tracks, high voltage lines, forest boundaries and, cultivated areas, etc.) has been identified throughout the lineaments and eliminated. The lineament overlay extracted on the vector file of the geological map of our site and high-resolution field imagery specific of the ArcGIS software (Source: Esri, Maxar, GeoEye, Earthstar Geographics, CNES/Airbus, DS, USDA, AeroGRID, IGN, and the GIS User Community) was indeed beneficial for validation as well. On investigation, three synthetic maps from the automatic extraction were developed with their statistical analyses (Directional rose and frequency of the number of lineaments). The first one concerns the lineaments extracted from the PC1 band of the ASTER satellite image (Figure 8A), and the second one refers to the lineaments extracted from the DEM (Figure 9A). The latter was digitalized based on the geological map of the study area (Figure 10A) and was later used and applied in the interpretation and validation of our findings.
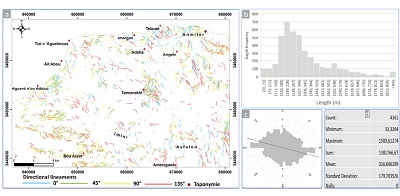 |
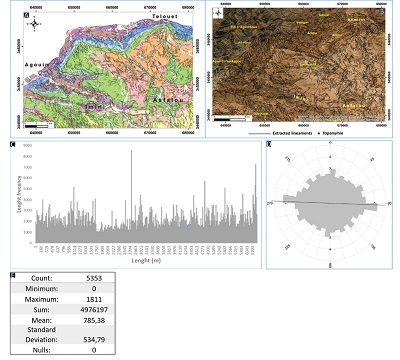
| Figure 8. (A) Synthetic lineament maps from the PC1 image after removal of non-geological lineaments, (B) length frequency diagram of lineaments, (C) rose diagram of lineaments, and (D) basic statistics of automatic lineament maps. |
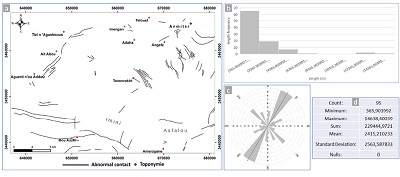
The statistical analysis of the lineaments extracted from the PC1 of the ASTER as well as the DEM images show that the PC1 image provides the extraction of more lineaments than DEM. On analysis, the number of lineaments extracted from PC1 was up to 4,361 lineaments, where their size varies from a few meters to 1.58 km, with an average length of 316 m. The total length of the mapped lineaments was approximately 1,381 km, where the largest number of low-range lineaments is depicted in Figures 8B and 8D. However, for the lineaments extracted from the DEM 992 lineaments were found whose size varies from 28 m to 3.96 km with an average length of 643 m and the total length of the mapped lineaments was about 637 km (Figures 9B and 9D).
 |
|
Figure 9. (A) Synthetic lineament maps from DEM image after removal of non-geological lineaments, (B) length frequency diagram of lineaments, (C) rose diagram of lineaments, and (D) basic statistics of automatic lineament maps. |
To study the geometry of the lineament network and to identify the dominant directions at the regional level, a statistical analysis of the lineaments was explored, the used technique was employed to produce directional rose proportional to the cumulative length of lineaments by 10° orientation classes.
The directional distribution (i.e. rose) of the lineaments appears in different directions for the PC1, DEM images along with the geological map that is shown in Figures 8C, 9C and10C, respectively. These roses show that the classes NE-SW and NW-SE represent the major directions of the linear frame for the provided results from the PC1 image (Figure 8C); while NE-SW and E-W classes are the most common directions for the obtained results from the DEM images (Figure 9C).
The comparison of the results of the extracted lineaments illustrated in Figures 8A and 9A and the lineaments of the geological map shown in Figure 10A shows that the lineaments can be grouped into different classes: some lineaments follow the direction of major fractures and others are certainly oriented differently. This will allow for the reproducibility of our study as several studies have recommended the application of a comparative analysis (Mabee et al., 1994). Therefore, the comparison of the lineament orientation demonstrates a good correlation with earlier work in the CHA. According to (El Moujahid et al., 2016), major lineament orientations ENE-WSW, WNW-ESE, NE-SW, and NW-SE were highlighted from the processing of a Landsat ETM satellite image. However, in the same region (i.e. CHA) Nouayti et al. (2017) showed that the lineament directions were NE-SO and E-O. Besides, Bentahar et al. (2020) indicated that the majority of the lineament directions were NE-SW and E-W, based on the ASTER L1B image processing.
 |
| Figure 10. (A) Synthetic lineament maps from a geological map of the study area, (B) length frequency diagram of lineaments, (C) rose diagram of lineaments, and (D) basic statistics of automatic lineament maps. |
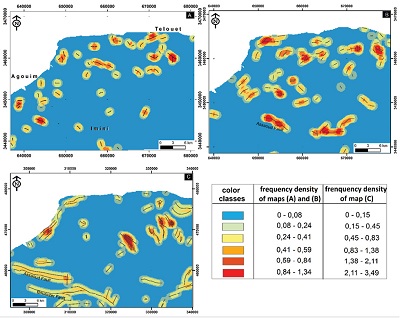
The second validation approach is based on density analysis (Figure 11), which represents the frequency of lineaments per unit area (Hung et al., 2005). In our work, we used the «Split line» tool of the «spatial analyst» section of the ArcGis software, which allowed us to draw linear density maps. The distribution of the high- and low-density zones of the lineaments are superimposed on the two different density maps. Consequently, the density of the lineaments is greater on the map generated from the PC1 image (Figure 11A) derived from the satellite image in comparison to the one produced from the DEM and geological map, shown in Figures 11B and 11C, respectively. The density of lineaments extracted automatically was found to be higher, especially in regions with high altitudes and peaks as well as in adjacent areas of the main faults.
 |
|
Figure 11. Lineament density map of lineaments extracted from (A) PC1 image, (B) DEM image, and (C) Geological map. |
We also noted that the lineament distribution is quite remarkable between the large accidents of the Bouazzer and Assaoud. However, the density of lineament maps of the ASTER image shows that these are concentrated in the Anmiter-Telouet region, to the west in the area of Agouim Tizi n’Aguelmous, and also at the Ordovician age sites in the Imini region, thereby, this could be related to the different phases of orogenesis affecting the entire study area.
To delineate whether or not our findings are valid, visual evidence of the study area constitutes one of the most crucial steps. Hence, obtaining it is the most reliable way to proceed with the validation of lineament maps (Kouamé et al., 1999). The lineament overlay taken from the PC1 image and the DEM on the slope maps depicted in Figures 12 A and B, respectively, shows that the lineament concentration is important in areas where the slopes are very steep and the changes are abrupt (Red pixels on maps).
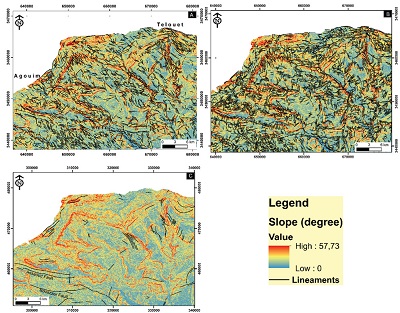 |
| Figure 12. Overlay of the slope image and resulting lineament maps from the PC1 image (A), the DEM image (B), and the Geological map (C). |
A contribution of the lithological factor, which is considered a vital geological factor controlling the spatial distribution of lineaments, was carried out in this investigation to provide more precision and reliability to our findings. In this regard, an overlay of the lithological map and the density map of the lineaments was performed. The lineaments were observed to be unequally distributed across the whole study area. In the southwest zone near the major faults of Bouazzer, Assaoud (Pouit, 1964) and the northeastern zone, the density of lineaments is remarkable. This is due to the geological characteristics of these formations (Competent rocks) and a long and complex sedimentary tectonic evolution related to the opening of the Atlantic Ocean at the beginning of the Mesozoic (pre-orogenic) (Choubert and Faure-Muret, 1960; Teixell et al., 2003). All in all, the concentration of the structural lineaments follows the direction of the major faults, namely the Atlasic South Accident and the Atlas Antia Major Accident. This distribution of fracturing is controlled by the genesis of the Atlas Mountains where fracturing is reduced from east to west (Bentahar et al., 2020). Moreover, the presence of lineaments in the studied region that form the covers, such as Cretaceous, Jurassic, Triassic, Eocene-Paleocene, and little Ordovician outcrop, can be explained by the accentuated shortening that affects the CHA (Benammi and Chakiri, 2001; de Lamotte et al., 2009). Finally, the geological layer vector (Figure 13A) and a high-resolution field image (Figure 13B) of our study area were selected to visualize the spatial distribution of validated lineaments; thus, these validation steps are important as additional support before visiting the field. As a result, our investigation contributes a useful reference to comprehend the geodynamics and geomorphology of this region as well as to improve the knowledge of the lineaments of the High Central Atlas of Morocco (Bednarik, 2019; Dormishi et al., 2018; Mafi-Gholami and Baharlouii, n.d.).
 |
|
Figure 13. (A) Overlay of the lineaments extracted from the geological layer vector and (B) from the high-resolution field image (Source: Esri, Maxar, GeoEye, Earthstar Geographics, CNES/Airbus, DS, USDA, AeroGRID, IGN, and the GIS User Community). (C) Length frequency diagram of lineaments, (D) diagram rose of lineaments, and (E) basic statistics of automatic lineament maps. |
- Conclusion
Automatic lineament mapping minimizes the amount of time spent in the field and provides a general overview of the geodynamics and geomorphology events of the region. In our work, two types of images including the ASTER L1B image, which was selected based on their spectral and spatial potential, and an ASTER-GDEM image with a resolution of 30 m were investigated. In order to compare and combine the results of two data sources (PC1 and DEM images), a specific methodology to extract a maximum lineament was performed. Based on these lineaments, the synthetic maps offer more details than the ones obtained by conventional methods.
In this regard, our results were comparable to previous studies that have validated the efficiency of the LINE module of “PCI Geomatica” based on automatic lineament detection algorithms. Among these investigations was a study carried out in the region of Nefza, northwest of Tunisia, on Landsat ETM-7 satellite data (Sedrette and Rebai, 2016). The extraction results show 100% reliability (Sedrette and Rebai, 2016) with respect to the lineament directions of the major families as shown by our similar results. However, in terms of quantity, the use of the ASTER sensor adopted for our study allows the extraction of a larger number of lineaments compared to Landsat. Further comparability was reported with the study conducted in the Alichur region, in order to evaluate the data from Landsat-8 optical satellites, Sentinel-2A and Sentinel-1A radars for automatic lineament extraction (Javhar et al., 2019). The results show that Sentinel 2A data seems to be important compared to some other sensors as well, but ASTER still remains the right choice in geological mapping considering its spectral and spatial capabilities. In the meantime, we have used this technique of automatic extraction of lineaments for geological and hydrological mapping in different sites in Morocco, such as the Ikniouen at the Anti Atlas of Morocco area, using Landsat 8 data (Abdelouhed et al., 2021) likewise, the technique of automatic extraction of lineaments has been successfully applied to the central Jebilets, using in this case, the ASTER data. (Abdelouhed et al., 2021). In both investigations, our results corroborate the field reality.
Spatial and statistical analyses of the validated lineaments by GIS and remote sensing tools have shown that there are 5,353 lineaments ranging in size from a few meters to 1.81 km, with an average length of 785 m. Although the lineaments with small extensions are the most numerous as already mentioned, the total length of the mapped lineaments is about 4,976 km. It has been shown that the projection of these lineaments is on a directional rose predominance of the WNW-ESE direction. In addition, the spatial distribution of lineaments was controlled by a set of lithological and different geodynamic phases in the entire study area. Furthermore, the lineaments were found to be more concentrated around the main faults already known at the study site.
In general, the obtained results in the framework of this study show the effectiveness of remote sensing in lineament mapping, especially in mountainous areas. Spatial remote sensing coupled with the GIS and automatic lineament extraction algorithms offers several advantages: fast and accurate discovery of difficult lineaments to survey by means of conventional methods (manual and semi-automatic). However, the automatic technique provides researchers with several geostatistical information (lineament density, lineament length, statistical tables, etc.) to understand the geodynamics of the region. These results also constitute a validation database of the lineament structures mapped in the field, facilitating future research. Nevertheless, this approach of automatic lineament extraction still requires certain field verification visits. This work will serve in the near future for exploration studies of groundwater reservoirs and will also contribute to the mapping of areas at risk of landslides (case of Tichka, Morocco).
Author contributions
Farah Abdelouhed: investigation, methodology, writing—original draft. Mohammed Ait Mlouk: investigation, methodology, writing-original draft. Mohammed Ifkirne: investigation, methodology, writing-original draft. Ahmed Algouti and Abdellah Algouti: Validation, writing-review and editing, supervision. The authors read and approved the final manuscript.
Financing
No specific funding has to be declared for this work.
Acknowledgments
The authors would like to thank the NASA-USGS GLOVIS-GATE for the satellite data (ASTER) and the NASA-USGS LP-DAAC for the GDEM data. The authors are very grateful to the anonymous reviewers for their valuable comments and suggestions, and to the journal editor for a careful review of the article which helped to present the work lucidly.
Conflict of interest
Authors declare that there are no conflicts of interest in developing this research.
Nomenclature
PCA, Principal component analysis; ASTER, Advanced Spaceborne Thermal Emission Reflection Radiometer; GDEM, Global Digital Elevation Model; VNIR, The visible/near-infrared; SWIR, The short-wave infrared; TIR, Thermal infrared; UTM, Universal Transverse Mercator projection; GIS, Geographic Information System, PC1, Principal component 1, ENVI, Environment for Visualizing Images.
References
Abdelouhed, F., Ahmed, A., Abdellah, A., Mohammed, I., 2021, Lineament mapping in the Ikniouen area (Eastern Anti-Atlas, Morocco) using Landsat-8 Oli and SRTM data: Remote Sensing Applications: Society and Environment, 23, 100606. https://doi.org/10.1016/j.rsase.2021.100606
Abdelouhed, F., Algouti, A., Algouti, A., Mohammed, I., Mourabit, Z., 2021, Contribution of GIS and remote sensing in geological mapping, lineament extractions and hydrothermal alteration minerals mapping using ASTER satellite images: case study of central Jebilets-Morocco: Disaster Advances, 14(1),15-25.
Abdullah, A., Akhir, J.M., Abdullah, I., 2010, Automatic mapping of lineaments using shaded relief images derived from digital elevation model (DEMs) in the Maran–Sungi Lembing area, Malaysia: Electronic Journal of Geotechnical Engineering, 15(6), 949–958.
Abdullah, A., Nassr, S., Ghaleeb, A., 2013, Landsat ETM-7 for lineament mapping using automatic extraction technique in the SW part of Taiz Area, Yemen: Global Jounals of Human-Social Sciences, 13(3), 35–37.
Adiri, Z., El Harti, A., Jellouli, A., Lhissou, R., Maacha, L., Azmi, M., Zouhair, M., Bachaoui, E.M., 2017, Comparison of Landsat-8, ASTER and Sentinel 1 satellite remote sensing data in automatic lineaments extraction: A case study of Sidi Flah-Bouskour inlier, Moroccan Anti Atlas: Advances in Space Research, 60(11), 2355–2367. https://doi.org/10.1016/j.asr.2017.09.006
Al-Dossary, S., Marfurt, K.J., 2007, Lineament-preserving filtering: Geophysics, 72(1), 1–8. https://doi.org/10.1190/1.2387138
Babault, J., Teixell, A., Struth, L., Van Den Driessche, J., Arboleya, M.L., Tesón, E., 2013, Shortening, structural relief and drainage evolution in inverted rifts: insights from the Atlas Mountains, the Eastern Cordillera of Colombia and the Pyrenees: Geological Society, London, Special Publications, 377(1), 141–158. https://doi.org/10.1144/sp377.14
Bednarik, R.G., 2019, Rock metamorphosis by kinetic energy: Emerging Science Journal, 3(5), 293–302. https://doi.org/10.28991/esj-2019-01192
Benammi, M., Chakiri, S., 2001, Les chevauchements frontaux du Haut Atlas central marocain: styles structuraux et taux de raccourcissement différentiel entre les versants nord et sud: Comptes Rendus de l’Académie Des Sciences-Series IIA-Earth and Planetary Science, 333(4), 241–247. https://doi.org/10.1016/s1251-8050(01)01628-7
Bentahar, I., Raji, M., Mhamdi, H.S., 2020, Fracture network mapping using Landsat-8 OLI, Sentinel-2A, ASTER, and ASTER-GDEM data, in the Rich area (Central High Atlas, Morocco): Arabian Journal of Geosciences, 13(16), 1–19. https://doi.org/10.1007/s12517-020-05736-6
Bonn, F., Rochon, G., 1992, Précis de Télédétection: Principes et Méthodes. Vol. 1. Sillery, Qc: Presses de l’Université Du Québec.
Choubert, G., Faure-Muret, A., 1960, Evolution du domaine atlasique marocain depuis les temps paléozoïques. Mémoire Hors-Série-Société Géologique de France, 1, 447–527.
de Lamotte, D. F., Leturmy, P., Missenard, Y., Khomsi, S., Ruiz, G., Saddiqi, O., Guillocheau, F., Michard, A., 2009, Mesozoic and Cenozoic vertical movements in the Atlas system (Algeria, Morocco, Tunisia): An overview: Tectonophysics, 475(1), 9–28. https://doi.org/10.1016/j.tecto.2008.10.024
Dormishi, A., Ataei, M., Mikaeil, R., Kakaei, R. K., 2018, Relations between texture coefficient and energy consumption of gang saws in carbonate rock cutting process: Civil Engineering Journal, 4(2), 413–421. https://doi.org/10.28991/cej-0309101
El Ghrabawy, O., Soliman, N., Tarshan, A., 2019, Remote sensing signature analysis of ASTER imagery for geological mapping of Gasus area, central eastern desert, Egypt: Arabian Journal of Geosciences, 12(13), 1–15. https://doi.org/10.1007/s12517-019-4531-9
El Harfi, A., Guiraud, M., Lang, J., 2006, Deep-rooted “thick skinned” model for the High Atlas Mountains (Morocco). Implications for the structural inheritance of the southern Tethys passive margin: Journal of Structural Geology, 28(11), 1958–1976. https://doi.org/10.1016/j.jsg.2006.08.011
El Moujahid, H.E.A., Ibouh, H., Bachnou, A., Babram, M.A., El Harti, A., 2016, Mapping and analysis of geological fractures extracted by remote sensing on Landsat TM images, example of the Imilchil-Tounfite area (Central High Atlas, Morocco): Estudios Geológicos, 72(2), e051. https://doi.org/10.3989/egeol.42328.394
Ettaki, M., Sadki, D., Chellaï, E.H., Milhi, A., 2008, Interaction eustatisme-tectonique dans le contrôle de la sédimentation au Jurassique inférieur et moyen dans la région de Todrha-Dadès (versant sud du Haut-Atlas central, Maroc): Notes Mémoires Serv. Géol. Maroc, 527, 55-64.
Gazi, O.B., Belal, M., Abdel-Galil, H., 2014, Edge detection in satellite image using cellular neural network: System, 8, 9.
Hamdani, N., Baali, A., 2019, Fracture network mapping using Landsat 8 OLI data and linkage with the karst system: a case study of the Moroccan Central Middle Atlas: Remote Sensing in Earth Systems Sciences, 2(1), 1–17. https://doi.org/10.1007/s41976-019-0011-y
Hashim, M., Ahmad, S., Johari, M.A.M., Pour, A.B., 2013, Automatic lineament extraction in a heavily vegetated region using Landsat Enhanced Thematic Mapper (ETM+) imagery: Advances in Space Research, 51(5), 874–890. https://doi.org/10.1016/j.asr.2012.10.004
Hung, L. Q., Batelaan, O., De Smedt, F., 2005, Lineament extraction and analysis, comparison of LANDSAT ETM and ASTER imagery. Case study: Suoimuoi tropical karst catchment, Vietnam: Remote Sensing for Environmental Monitoring, GIS Applications, and Geology V, 5983, 59830T. https://doi.org/10.1117/12.627699
Javhar, A., Chen, X., Bao, A., Jamshed, A., Yunus, M., Jovid, A., Latipa, T., 2019, Comparison of multi-resolution optical Landsat-8, Sentinel-2 and radar Sentinel-1 data for automatic lineament extraction: A case study of Alichur area, SE Pamir: Remote Sensing, 11(7), 778. https://doi.org/10.3390/rs11070778
Jordan, G., Schott, B., 2005, Application of wavelet analysis to the study of spatial pattern of morphotectonic lineaments in digital terrain models. A case study: Remote Sensing of Environment, 94(1), 31–38. https://doi.org/10.1016/j.rse.2004.08.013
Koita, M., Jourde, H., Ruelland, D., Koffi, K., Pistre, S., Savane, I., 2010, Cartographie des accidents régionaux et identification de leur rôle dans l’hydrodynamique souterraine en zone de socle. Cas de la région de Dimbokro-Bongouanou (Côte d’Ivoire): Hydrological Sciences Journal, 55(5), 805–820. https://doi.org/10.1080/02626667.2010.489749
Kouamé, K.F., Gioan, P., Biémi, J., Affian, K., 1999, Méthode de cartographie des discontinuités-images satellitales: Exemple de la région semi-montagneuse à l’ouest de la Côte d’Ivoire: Télédétection, 2, 139–156.
Lepage F., 2002, Triangle and Tetrahedral Meshes for Geological Models. 22nd GoCAD-Meeting, Nancy, France, 15.
Lim, C.S., Ibrahim, K., Tjia, D., 2001, Radiometric and Geometric information content of Tiung Sat-l MSEIS data. Tiung SAT-1: From Inception to Inauguration, 169–184.
Mabee, S.B., Hardcastle, K.C., Wise, D.U., 1994, A method of collecting and analyzing lineaments for regional‐scale fractured‐bedrock aquifer studies: Groundwater, 32(6), 884–894.
Mafi-Gholami, D., Baharlouii, M. (n.d.). Monitoring Long-term Mangrove Shoreline Changes along the Northern Coasts of the Persian Gulf and the Oman Sea.
Mallast, U., Gloaguen, R., Geyer, S., Rödiger, T., Siebert, C., 2011, Derivation of groundwater flow-paths based on semi-automatic extraction of lineaments from remote sensing data: Hydrology and Earth System Sciences, 15(8), 2665–2678. https://doi.org/10.5194/hess-15-2665-2011
Martial, A.J., Joseph, M.O., Bosco, O.J., Jean, E., KEMENG, M.P., 2013, Utilisation des modèles numériques de terrain (MNT) SRTM pour la cartographie des linéaments structuraux: Application à l’Archéen de Mezesse à l’est de Sangmélima (Sud-Cameroun): Geo-Eco-Trop, 37(1), 71–80.
Mouissi, S., Alayat, H., 2016, Utilisation de l’analyse en composantes principales (ACP) pour la caractérisation physico-chimique des eaux d’un ecosystème aquatique: Cas du Lac Oubéira (Extrême NE Algérien)[Use of the principal component analysis (PCA) for physico-chemical charcterizat: Journal of Materials and Environmental Science, 7(6), 2214–2220.
Nouayti, N., Khattach, D., Hilali, M., 2017, Cartographie des zones potentielles pour le stockage des eaux souterraines dans le haut bassin du Ziz (Maroc): Apport de la télédétection et du système d’information géographique: Bulletin de l’Institut Scientifique, Rabat, Section Sciences de La Terre, 39(45–57), 13.
O’Leary, D.W., Friedman, J.D., Pohn, H., 1976, Lineament, Linear, Lineation: Some proposed new standard for old terms: Geol. Soc. Amer. Bull., 87, 1463–1469.
Pouit, G., 1964, Les gîtes de manganèse marocains encaissés dans les formations carbonatées: éléments pour une synthèse: Chronique Des Mines et de La Recherche Minière, 32(336), 331–343.
Richards, J.P., 2000, Lineaments revisited. SEG Newsletter 42. Postsubduction porphyry Cu-Au and epithermal Au deposits: Products of the remelting of subduction-modified lithosphere: Geology, 37, 247–250. https://doi.org/10.1130/g25451a.1
Saddiqi,O., Baidder,L., Michard, A., 2011,Haut Atlas et Anti‐Atlas, Circuit oriental, in Michardetal, A. (ed.),Nouveaux guides géologiques et miniers du Maroc, Notes Mém. Service Géologique Du Maroc, 557, Rabat,Maroc.
Saepuloh, A., Haeruddin, H., Heriawan, M.N., Kubo, T., Koike, K., Malik, D., 2018, Application of lineament density extracted from dual orbit of synthetic aperture radar (SAR) images to detecting fluids paths in the Wayang Windu geothermal field (West Java, Indonesia): Geothermics, 72, 145–155. https://doi.org/10.1016/j.geothermics.2017.11.010
Sander, P., 2007, Lineaments in groundwater exploration: a review of applications and limitations: Hydrogeology Journal, 15(1), 71–74. https://doi.org/10.1007/s10040-006-0138-9
Savané, I., 1997, Contribution à l’étude géologique et hydrogéologique des aquifères discontinus du socle cristallin d’Odienné (Nord-Ouest de la Côte d’Ivoire). Apport de la Télédétection et d’un système d’information hydrogéologique à référence spatiale. Apport de La Télédétection et d’un Systeme d’information Hydrogéologique Aréférence Spatiale: Université de Cocody (Abidjan), These de Doctorat d’État.
Sedrette, S., Rebai, N., 2016, Automatic extraction of lineaments from Landsat Etm+ images and their structural interpretation: Case study in Nefza region (North West of Tunisia): Journal of Research in Environmental and Earth Sciences, 4(2016), 139–145.
Sharifi, A., Malian, A., Soltani, A., 2018, Efficiency evaluating of automatic lineament extraction by means of remote sensing (Case study: Venarch, Iran): Journal of the Indian Society of Remote Sensing, 46(9), 1507–1518. https://doi.org/10.1007/s12524-018-0798-7
Singhal, B.B.S., Gupta, R.P., 2010, Applied hydrogeology of fractured rocks. Springer Science & Business Media.
Teixell, A., Arboleya, M., Julivert, M., Charroud, M., 2003, Tectonic shortening and topography in the central High Atlas (Morocco): Tectonics, 22(5), 1051. https://doi.org/10.1029/2002tc001460
Thannoun, R G., 2013, Automatic extraction and geospatial analysis of lineaments and their tectonic significance in some areas of Northern Iraq using remote sensing techniques and GIS: International Journal Of Enhanced Research In Science Technology & Engineering Bulletin, 2(2), 1–11.
Yesou, H., Besnus, Y., Rolet, J., 1993, Extraction of spectral information from Landsat TM data and merger with SPOT panchromatic imagery—a contribution to the study of geological structures: ISPRS Journal of Photogrammetry and Remote Sensing, 48(5), 23–36.
Manuscript received: April 12, 2021
Corrected manuscript received: October 25, 2021
Manuscript accepted: November 5, 2021
Peer Reviewing under the responsibility of Universidad Nacional Autónoma de México.
This is an open access article under the CC BY-NC-SA license(https://creativecommons.org/licenses/by-nc-sa/4.0/)