
|
Boletín de la Sociedad Geológica Mexicana Volumen 74, núm. 2, A230222, 2022 http://dx.doi.org/10.18268/BSGM2022v74n2a230222
|
 |
Deformación del Cretácico tardío en el límite de la Mesa Central y la Sierra Madre Oriental, centro de México
Late Cretaceous deformation at the border between the Mesa Central and the Sierra Madre Oriental, central Mexico
Gonzalo Cid-Villegas1,*, Susana Alicia Alaniz-Álvarez 2, Shunshan Xu2, Alberto Vásquez-Serrano3, Edgar Juárez-Arriaga3
1 Posgrado en Ciencias de la Tierra, Centro de Geociencias, Universidad Nacional Autónoma de México, Blvd. Juriquilla No. 3001, 76230, Querétaro, México.
2 Centro de Geociencias, Universidad Nacional Autónoma de México, Blvd. Juriquilla No. 3001, 76230, Querétaro, México.
3 Instituto de Geología, Universidad Nacional Autónoma de México, Av. Universidad No. 3000, 04510, CDMX, México.
* Autor para correspondencia:(G. Cid-Villegas) This email address is being protected from spambots. You need JavaScript enabled to view it.
Cómo citar este artículo:
Cid-Villegas, G., Alaniz-Álvarez, S. A., Xu, S., Vásquez-Serrano, A., Juárez-Arriaga, E., 2022, Deformación del Cretácico tardío en el límite de la Mesa Central y la Sierra Madre Oriental, centro de México: Boletín de la Sociedad Geológica Mexicana, 74 (2), A230222. http://dx.doi.org/10.18268/BSGM2022v74n2a230222
Manuscrito recibido: 29 de Mayo de 2021; Manuscrito corregido: 4 de Noviembre de 2021; Manuscrito aceptado: 22 de Febrero de 2022.
RESUMEN
En el centro de México se han identificado dos eventos tectónicos importantes del Cretácico: la acreción del Terreno Guerrero (Cretácico Temprano) y la formación del Orógeno Mexicano (Cretácico Tardío-Paleógeno). Ambos eventos presentan una dirección de transporte tectónico al noreste en el centro del país, y han sido estudiados tanto en la Mesa Central, como en la Sierra Madre Oriental. No obstante, pocos trabajos han caracterizado la deformación contractiva en el límite entre ambas provincias. Con el fin de contribuir a una mejor comprensión de la deformación del Cretácico Tardío en el centro de México, el presente trabajo se enfoca en el límite de ambas provincias, especialmente en las localidades Juriquilla, San Miguel de Allende y la Sierra de los Cuarzos. Los objetivos de este trabajo fueron: a) Identificar la deformación contractiva de las rocas mesozoicas de la zona de estudio. b) Determinar variaciones en la dirección de transporte tectónico de la zona de estudio con respecto a la Mesa Central y Sierra Madre Oriental. En este estudio se reportan nuevos datos estructurales y edades U-Pb en granos de circón detrítico. Se discute sobre la posibilidad de tener dos eventos de deformación contractiva. El evento D1 se infiere contemporáneo a la acreción del Terreno Guerrero y se observa en las rocas más antiguas de Sierra de los Cuarzos. Por su parte, las edades máximas de depósito obtenidas en San Miguel de Allende y Juriquilla, 110.2 ± 0.8 Ma y 110.5 ± 0.9 Ma (Albiano temprano), respectivamente, limitan la edad de la deformación D2, siendo posterior a los ~110 Ma. Por lo tanto, esta deformación resulta contemporánea a la formación del Orógeno Mexicano. El evento D2 se observa en las tres áreas. Mediante el análisis estructural se determinó que D1 tiene una dirección de transporte al sureste, mientras que D2 presenta una dirección de transporte general al oeste-suroeste o suroeste. Estas direcciones de transporte difieren al de la acreción del Terreno Guerrero y al de la formación del Orógeno Mexicano. Esta diferencia en la dirección de transporte podría ser producto de retrodeformación, y/o heterogeneidades en el basamento.
Palabras clave: Deformación contractiva del Cretácico Tardío, análisis estructural, transporte tectónico, geocronología U-Pb, centro de México.
ABSTRACT
In central Mexico, two important Cretaceous tectonic events have been identified: the accretion of the Guerrero Terrain (Early Cretaceous) and the beginning of the Mexican Orogen (Late Cretaceous-Paleogene). Both events present a direction of tectonic transport to the northeast in the center of México, and they have been studied both in the Mesa Central and in the Sierra Madre Oriental. However, little study has characterized the contractile deformation in the border between both provinces. In order to contribute to a better understanding of the Late Cretaceous deformation in central Mexico, this research focuses on the border of both provinces, especially in the Juriquilla, San Miguel de Allende localities, and Sierra de los Cuarzos. The objectives of this research were a) Identify the contractile deformation of the Mesozoic rocks in the study area. b) Determine variations in the direction of tectonic transport of the study area concerning the Mesa Central and Sierra Madre Oriental. In this research, new structural data and U-Pb ages in detrital zircon grains are reported. The possibility of having two contractive deformation events is discussed. The D1 event is inferred contemporary to the accretion of the Guerrero Terrain and is observed in the oldest rocks of Sierra de los Cuarzos. On other hand, the maximum deposit ages obtained in San Miguel de Allende and Juriquilla, 110.2 ± 0.8 Ma and 110.5 ± 0.9 Ma (Early Albian), respectively, limit the age of the D2 deformation, being after ~ 110 Ma. Therefore, this resulting deformation contemporaneous with the formation of the Mexican Orogen. Event D2 is observed in all three areas. Through the structural analysis it was determined that D1 has a direction of transport to the southeast, while D2 has a direction of transport to the west-southwest or southwest. These transport directions differ from that of the Guerrero Terrain accretion and from the formation of the Mexican Orogen. This difference in the direction of transport could be the product of retrodeformation, and or heterogeneities in the basement.
Keywords: Late Cretaceous contractive deformation, structural analysis, tectonic transport, U-Pb geochronology, central Mexico.
- Introducción
La evolución tectónica en el centro de México a finales del Mesozoico involucra dos eventos geológicos importantes: 1) la acreción del Terreno Guerrero al núcleo continental en el Cretácico Temprano, y 2) el inicio de la formación del Orógeno Mexicano en el Cretácico Tardío (Cuéllar-Cárdenas et al., 2012; Palacios-García y Martini, 2014; Martini et al., 2016; Fitz-Díaz et al., 2018). Ambos eventos muestran deformación contractiva con una dirección de transporte tectónico general hacia el noreste (Fitz-Díaz et al., 2012; 2014; 2018; Martini et al., 2016; Vásquez-Serrano et al., 2018; 2019), salvo algunas variaciones locales en la parte centro del país (Fitz-Díaz et al., 2008; Martini et al., 2013; Palacios-García y Martini, 2014). En los últimos años se han incrementado los trabajos centrados en conocer la cinemática, tectónica, sedimentación, temporalidad y propagación de la deformación de los eventos tectónicos en el centro del país (Fitz-Díaz et al., 2018; Vásquez-Serrano et al., 2018; Juárez-Arriaga et al., 2019a). Esto ha permitido diferenciar cada evento; sin embargo, su completo entendimiento se ha dificultado, ya que la mayoría de las rocas mesozoicas en el centro del país están sepultadas por los eventos volcánicos del Cenozoico. La zona de estudio se ubica en el límite de las provincias fisiográficas Mesa Central (MC), Sierra Madre Oriental (SMOr), y Faja Volcánica Transmexicana (FVTM), e incluye las localidades de Juriquilla, Querétaro, San Miguel de Allende, y Sierra de los Cuarzos, Guanajuato, en la parte central del México (Figura 1a).
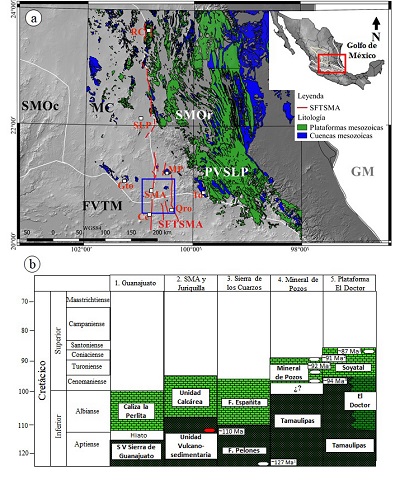 |
| Figura 1. Ubicación del área de estudio y distribución del Sistema de Fallas Taxco-San Miguel de Allende. a) El recuadro superior derecho enmarca la parte centro-oriente de México, donde se muestra la distribución de las plataformas y cuencas mesozoicas. Los límites de las provincias fisiográficas son aproximados (líneas blancas). El recuadro azul muestra la ubicación del área de estudio. Note el acortamiento en la distribución de las rocas de plataforma justo donde el Sistema de Fallas Taxco San Miguel de Allende se ensancha. Abreviaturas: SMOr, Sierra Madre Oriental; MC, Mesa Central; FVTM, Faja Volcánica Transmexicana; SMOc, Sierra Madre Occidental; PVSLP, Plataforma Valles-San Luis Potosí; SFTSMA, Sistema de Fallas Taxco San Miguel de Allende. Ciudades: Ce, Celaya; Gto, Guanajuato; MP, Mineral de Pozos; Qro, Querétaro; RC, Real de Catorce; SLP, San Luis Potosí; SMA, San Miguel de Allende; To, Tolimán; b) Tabla de correlación estratigráfica para el centro de México. El grano de circón rojo corresponde a la edad U/Pb obtenida en este trabajo. Los granos de circón blanco corresponden a las edades máximas de depósito publicadas para las sucesiones del Cretácico en el centro de México y provienen de: 1Palacios-García y Martini (2014); 2Ortega-Flores et al., (2014); 3Juárez-Arriaga et al., (2019a). |
En este trabajo se caracterizó la deformación cretácica de las rocas mesozoicas en el área de estudio y se identificó a qué evento geológico corresponde esta deformación. Para ello, se calculó la edad máxima de depósito mediante el fechamiento de sucesiones sedimentarias, utilizando edades U-Pb en granos de circón detrítico. Asimismo, se determinó la dirección del transporte tectónico de las rocas mesozoicas del área de estudio a través de la vergencia de los pliegues regionales, fallas inversas, e indicadores cinemáticos. La dirección de transporte tectónico obtenida en este estudio se comparó con las direcciones de transporte publicadas en áreas adyacentes, que incluyen las localidades Mineral de Pozos (Reyes-Reyes y Luna-Castro, 1998) y Tolimán (Fitz-Díaz et al., 2012) al este del área de estudio, y con la localidad de Guanajuato (Martini et al., 2013) al oeste.
- Marco geológico
2.1. MARCO GEOLÓGICO REGIONAL
La MC se caracteriza por ser una meseta elevada que presenta cotas promedio mayores a sus áreas adyacentes (Nieto-Samaniego et al., 1999a; 2007). La SMOr es la expresión fisiográfica del Cinturón de Pliegues y Cabalgaduras Mexicano (CPCM; Fitz-Díaz et al., 2012; 2018). En la parte centro-este de México la SMOr está compuesta por cuencas y plataformas cretácicas que muestran una dirección de transporte tectónico hacia el noreste (Fitz-Díaz et al., 2012; 2018). En esta zona la SMOr presenta deformación de piel delgada (Eguiluz de Antuñano et al., 2000; Fitz-Díaz et al., 2012; 2018). La FVTM es un arco volcánico continental del Neógeno que cruza el centro del país de oeste a este (Ferrari et al., 2012). Se localiza justo en la margen sur de la placa Norteamericana y sus productos ígneos de composición variable (Ferrari et al., 2012) cubren a las rocas mesozoicas de la mayor parte del centro del país.
Durante el Cretácico Temprano la zona de estudio fue ocupada por ambientes carbonatados profundos y de plataforma (e.g. Wilson y Ward, 1993). Los sistemas de plataformas están representados en el centro-este de México por la Plataforma Valles-San Luis Potosí (PVSLP; Figura 1a). Esta plataforma consiste en facies arrecifales y de talud. Mientras, en la parte central de la actual MC se localizan depósitos marinos de mar abierto y aguas profundas principalmente calizas arcillosas y lutitas calcáreas (Nieto-Samaniego et al., 2007). En tanto que, en la parte oeste de la MC, principalmente en la actual Sierra de Guanajuato existieron depósitos volcanosedimentarios marinos, los cuales tuvieron grandes espesores de basalto almohadillado intercalados con capas de lutita, arenisca y caliza (Tardy et al., 1994; Martini et al., 2011). De esta forma, durante el Cretácico Temprano existió un extenso sistema de plataformas carbonatadas hacia el oriente, en la parte central una gran cuenca que en su extremo más occidental tuvo mayor aportación vulcanosedimentaria (Nieto-Samaniego et al., 2007). Esta cuenca la define Carrillo-Bravo (1971) como la Cuenca Mesozoica del Centro de México (CMCM).
Hacia el límite Cretácico Temprano-Tardío la parte oeste de la MC formó parte del antepaís asociado al Orógeno Mexicano, nombrado Sistema de Cuencas de Antepaís Mexicano (Juárez-Arriaga et al., 2019b). En la figura 1b se observa una tabla de correlación estratigráfica esquemática del centro de México, que muestra la litología del Cretácico. Sobre las rocas deformadas de la cuenca yacen en discordancia angular, rocas continentales y volcánicas cenozoicas (Nieto-Samaniego et al., 2007).
El límite entre la MC y SMOr es el Sistema de Fallas Taxco-San Miguel de Allende (SFTSMA). El SFTSMA es la única estructura reconocida que atraviesa todo el vulcanismo del centro del país (Alaniz-Álvarez y Nieto-Samaniego, 2005). Este sistema de fallas tiene una orientación NNW-SSE con más de 500 km de longitud. Así también, la traza de la falla del SFTSMA coincide con el límite este de la CMCM (Nieto-Samaniego et al., 2005). De igual forma, la zona más ancha del SFTSMA se localiza dentro del área de estudio (35 km) y coincide con el cambio en la orientación del límite oeste del PVSLP donde esta plataforma se hace más angosta (Figura 1a).
Algunos autores han sugerido que el SFTSMA es un límite cortical (Alaniz-Álvarez et al., 2002a). Esta hipótesis está basada en la existencia de al menos cuatro eventos de deformación asociados al SFTSMA que corresponden a: la formación del Orógeno Mexicano, un evento extensional del Eoceno, la formación de la SMOr, y un último evento asociado a la formación de la FVTM (Alaniz-Álvarez et al., 2002a). Adicionalmente, dicha hipótesis se sustenta en la topografía y espesor de la corteza, las cuales son variables hacia el oeste y este del SFTSMA (Kerdan, 1992; Campos-Enríquez et al., 1994; Nieto-Samaniego et al., 1999a). El espesor de la corteza dentro de la MC es de 32 km, mientras que el espesor en la SMOr es de 37 km (Rivera y Ponce, 1986; Kerdan, 1992; Nieto-Samaniego et al., 1999a, 2007).
2.2. MARCO GRAVIMÉTRICO REGIONAL
De acuerdo con los datos gravimétricos satelitales (Scripps Institution of Oceanography, 2014), el área de estudio se localiza en una zona de transición de un alto gravimétrico A1, a un bajo gravimétrico B1 (Figura 2). La Figura 2 muestra la anomalía de Bouguer regional, el contraste que existe entre los altos y bajos gravimétricos A1 y B1 podría ser producto de cuerpos profundos con grandes longitudes de onda asociados al basamento (Spector y Grand, 1970).
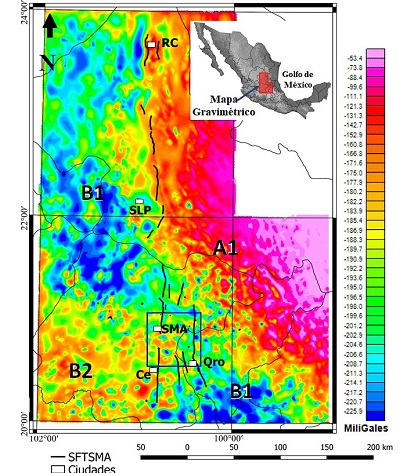 |
| Figura 2. Mapa gravimétrico de la Anomalía de Bouguer regional. El recuadro superior derecho muestra su ubicación en el centro de México. Note la existencia de dos grandes dominios: A1 y B2, y una zona intermedia B2. Las diferencias entre los dominios pueden ser producto de cuerpos profundos de grandes longitudes de onda que podrían estar asociados a los basamentos de la Mesa Central y la Sierra Madre Oriental. El SFTSMA limita ambos dominios hacia la parte norte (indicado por las líneas negras). El recuadro azul corresponde al área de estudio, la cual concuerda con el área donde se ensancha el SFTSMA y con la zona de transición entre A1 y B2, Las abreviaturas son las mismas que la figura 1. |
2.3. ESTRATIGRAFÍA GENERAL DEL ÁREA DE ESTUDIO
La unidad litológica más antigua corresponde a la Secuencia Vulcanosedimentaria Sierra de Guanajuato y cuya edad es del Jurásico Tardío-Cretácico Temprano (Martínez-Reyes, 1992; Martini et al., 2011). Aflora principalmente en el escarpe de la falla San Miguel de Allende, en la parte central de la Sierra de los Cuarzos y al norte de Celaya (Figura 3). Esta unidad consiste en una sucesión de arenisca, lutita y pedernal que se intercala con rocas volcánicas principalmente de composición básica (Martínez-Reyes, 1992; Nieto-Samaniego et al., 1999b; Alaniz-Álvarez et al., 2001; Gámez-Ordaz y Ávila-Ramos, 2017). En la Sierra de los Cuarzos esta unidad consiste en dos formaciones; la primera, la formación Sierra de los Cuarzos del Jurásico Superior compuesta en su base por una alternancia de arenisca, limolita y lutita, arenisca vulcanosedimentaria y hacia su cima por turbiditas calcáreas intercaladas con arenisca y esquisto (Palacios-García y Martini. 2014); y la segunda, la formación Pelones del Cretácico Superior compuesta de arenisca vulcanoclástica, conglomerado y lutita (Palacios-García y Martini, 2014). Dentro del área de estudio la unidad cretácica más antigua fue nombrada informalmente unidad vulcanosedimentaria.
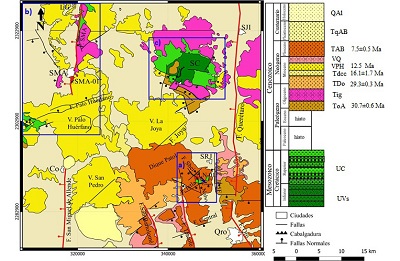 |
| Figura 3. Mapa Geológico-Estructural del área de estudio basado en el trabajo de Alaniz-Álvarez et al. (2001). Los recuadros indican las tres zonas estructurales estudiadas: a) Juriquilla, b) San Miguel de Allende y c) Sierra de los Cuarzos. Las localidades donde fueron colectadas las muestras geocronológicas LN-01 y SMA-01 corresponden a las estrellas. Abreviaturas: F. 5F, Falla 5 de Febrero; F. Qro., Falla Querétaro. Ciudades: Co, Comonfort; LG, Los Guías; Qro, Querétaro; SC, Sierra de los Cuarzos; SJI, San José Iturbide; SMA, San Miguel de Allende; SRJ, Santa Rosa Jauregui; Unidades litológicas: UVs, Unidad vulcanosedimentaria; UC, Unidad calcárea; ToA, Andesita El Cedro; Tig, Ignimbrita Oligo-miocénica; TDo, Dacita Obrajuelos; Tdcc. Cerro Colorado; VPH, Vulcanoclástico Palo Huérfano; VQ, Vulcanoclástico Querétaro; TAB, Basalto Querétaro; TqAB, Andesita y Basalto del Plioceno; QAl, Lacustre-aluvión. |
La unidad vulcanosedimentaria subyace a una intercalación de caliza, lutita y arenisca (Figura 3; Alaniz-Álvarez et al., 2001). Al occidente, fuera del área de estudio se ha identificado una caliza con características similares nombrada caliza La Perlita (Quintero-Legorreta, 1992) descrita como una secuencia calcárea-arenosa de edad Aptiana-Albiana. Su edad fue estimada a partir de una amonita documentada en un afloramiento cercano a San Miguel de Allende (Chiodi et al., 1988). El ambiente de depósito de la caliza la Perlita se ha considerado arrecifal o de plataforma (Quintero-Legorreta, 1992). En la Sierra de los Cuarzos aflora la formación Españita constituida por una alternancia rítmica de caliza detrítica, marga, lutita y pedernal. Su edad no fue determinada, pero por relaciones estratigráficas se le asignó una edad de Albiano-Cenomaniano (Palacios-García, 2013; Palacios-García y Martini, 2014). Dentro del área de estudio la unidad cretácica más reciente es nombrada informalmente unidad calcárea.
La roca cenozoica más antigua corresponde a la Andesita El Cedro (ToA), aflora en la Sierra de Los Cuarzos, y al norte de la ciudad de Querétaro (Figura 3). Consiste en lavas y algunas tobas basálticas-andesíticas (Alaniz-Álvarez et al., 2001), con edades entre 30.6 ±0.4 Ma y 30.7 ±0.6 Ma (Cerca-Martínez et al., 2000). Sobreyaciendo se encuentran ignimbritas del Oligoceno-Mioceno (Tig). Localizadas en la parte norte de área de estudio, en el bloque levantado de la falla San Miguel de Allende, dentro de la Sierra de los Cuarzos, y al sur del poblado de San José Iturbide (Figura 3). Corresponde a una ignimbrita ácida (Alaniz-Álvarez et al., 2001), con una edad de 29.3 ±0.3 Ma (Aguirre-Díaz y López-Martínez, 2001). La sucesión continúa con la Dacita Obrajuelo (TDo), corresponde a una alineación de domos rumbo NE-SW, en la porción sureste del volcán San Pedro y el poblado de Santa Rosa Jauregui (Figura 3). Sobreyaciendo la Dacita Obrajuelo se encuentra la secuencia Cerro Colorado (Tdcc) constituida por lahares y brechas andesíticas-dacíticas. Se localizada en el flanco oriental del volcán Palo Huérfano (Figura 3), con una edad de 16.1 ±1.7 Ma (Pérez-Venzor et al., 1996). Durante el Neógeno, se depositaron rocas de composición andesítica-basáltica (VPH) perteneciente a los estratovolcanes Palo Huérfano, La Joya y San Pedro (Figura 3), con una edad de 12.5 Ma (Pérez-Venzor et al., 1996). Sobre el material de los estratovolcanes se localiza el Vulcanoclástico Querétaro (VQ), conformada por depósitos fluviales, aluviales, lacustres y piroclásticos no consolidados (Figura 3), De igual forma se depositaron los basaltos Querétaro (TAB), agrupan derrames fisurales, aparatos centrales y conos cineríticos de composición basáltica, fechados en 7.5 ±0.5 Ma y 5.6 ±0.4 Ma (Aguirre-Díaz y López-Martínez, 2001). Finalmente, en la cima de la sucesión cenozoica se encuentran andesitas y basaltos del Plioceno (TqAB), y rellenos Aluviales (QAl).
2.4. ESTRUCTURAS GEOLÓGICAS DEL ÁREA DE ESTUDIO
2.4.1. ESTRUCTURAS DE ACORTAMIENTO
En el área de estudio hay evidencia de deformación contractiva (fallas inversas, pliegues, clivaje axial) a escala de afloramiento. Se observa principalmente en la zona de contacto cizallado entre las unidades mesozoicas al suroeste de San Miguel de Allende (Nieto-Samaniego et al., 1999b) y en la parte oriental de Sierra de los Cuarzos (Palacios-García, 2013; Palacios-García y Martini, 2014), se caracteriza por ser un clivaje penetrativo a escala de afloramiento. De igual forma se observan pliegues y clivaje axial en la parte oriental de Juriquilla. Además, Palacios-García y Martini (2014) documentan que el contacto cizallado entre las unidades mesozoicas en la Sierra de los Cuarzos presenta una vergencia hacia el suroeste, que se manifiesta en la unidad superior de cada zona cizallada. No se tiene estimado el espesor de estas zonas de cizalla frágil-dúctil, sin embargo, se manifiesta foliación penetrativa a escala milimétrica-submilimétrica y lineaciones minerales. De igual forma se reconocen peces de moscovita, estructuras S-C y pórfidosclastos asimétricos que sustentan la vergencia al SW (Palacios-García, 2013; Palacios García y Martini, 2014). Por su parte, Nieto-Samaniego et al., (1999b) documentan el contacto entre las unidades mesozoicas al suroeste del área de San Miguel de Allende, corresponde a una zona de cizalla, que de acuerdo con su sección D-D’ presenta una dirección de transporte tectónico al suroeste. Si bien, todas estas estructuras se manifiestan de carácter local, sólo en la parte central de la Sierra de los Cuarzos la cabalgadura Encino Rizudo (Figura 3) es la única estructura a gran escala existente. Presenta un rumbo NE-SW y una dirección de transporte tectónico al SE (Gámez-Ordaz y Ávila-Ramos, 2017).
2.4.2. ESTRUCTURAS DE EXTENSIÓN
De manera regional se reconocen 3 sistemas de fallas cenozoicas con orientaciones generales N-S, NE-SW y NW-SE. A continuación, se describen de manera general cada uno de estos sistemas de fallas.
2.4.2.1 SISTEMA DE FALLAS N-S
Este sistema de fallas está representado principalmente por la falla San Miguel de Allende, una falla normal con rumbo N-S y echado al poniente. Esta falla atraviesa la ciudad de San Miguel de Allende y expone las rocas mesozoicas en su escarpe de falla (Figura 3). Hacia el sur es sepultada por el vulcanismo del volcán Palo Huérfano y sedimentos continentales del Mioceno al Reciente (Alaniz-Álvarez et al., 2001). El segmento que atraviesa el área de estudio tiene una longitud de 38 km y más de 300 m de desnivel, la actividad de la falla se dio principalmente en el Oligoceno y una segunda etapa de reactivación en el Mioceno (Alaniz-Álvarez et al., 2001).
En el sector oriental del área de estudio, se encuentra el sistema de fallas Querétaro perteneciente al SFTSMA. Este sistema de fallas está representado por cuatro fallas principales con una orientación N-S. Estas fallas son: Querétaro, 5 de Febrero, Tlacote y San Bartolomé (Alaniz-Álvarez et al., 2001). La falla Querétaro es de tipo normal con echado hacia el oeste, una longitud de 61 km y un desplazamiento máximo de 80 m. La traza de la falla se reconoce por la diferencia topográfica entre San José de Iturbide y Santa Rosa Jáuregui (Alaniz-Álvarez et al., 2001). La falla 5 de Febrero es una falla normal con echado hacia el oeste, 14 km de longitud y con un desplazamiento vertical de más de 100 m (Alaniz-Álvarez et al., 2001, Xu et al., 2011). La falla Tlacote es una falla normal con echado hacia el este, una longitud de 20 km y un desplazamiento vertical de 80 m (Alaniz-Álvarez et al., 2001). La falla San Bartolomé es de tipo normal con echado al este, una longitud de 27 km, y un desplazamiento máximo de 100 m en su sector norte y 50 m en su sector sur (Alaniz-Álvarez et al., 2001).
2.4.2.2 SISTEMA DE FALLAS NE-SW
Este sistema de falla es representado por fallas y centros de emisión volcánicos con una orientación NE-SW. Las estructuras corresponden a fallas normales de alto ángulo con longitudes de fallas que van de 5 a 15 km. Sus escarpes van de 30 a 100 m. Su desplazamiento fue mucho mayor que 100 m debido a que el bloque del alto expone el basamento mesozoico en Juriquilla (Alaníz-Álvarez et al., 2001). Además, al sur de la ciudad de Querétaro este sistema se compone de varios segmentos de falla de 5 km de longitud con echado al noroeste. Estas fallas cortan al volcán Cimatario, los basaltos Querétaro y a fallas del SFTSMA. Las principales fallas son: Ixtla, La Joya y Palo Huérfano (Figura 3). Además, lineamientos de volcanes monogenéticos (e.g., Dique El Patol) y domos riolíticos alineados (Alaniz-Álvarez et al., 2001).
2.4.2.3 SISTEMA DE FALLAS NW-SE
Este sistema de fallas consta de fallas de alto ángulo, y se han estudiado detalladamente en Guanajuato y San Luis Potosí (Alaniz-Álvarez et al., 2001). Del Pilar-Martínez et al. (2020) documentaron fallas normales del pre-Oligoceno con orientación NW-SE, al norte del área de estudio. Dentro de la zona de estudio estas fallas se manifiestan principalmente en la Sierra de los Cuarzos (Figura 3). Entre las fallas más importantes están: La falla el Moral con una longitud de 12.7 km y echado al suroeste y falla Puerto Nieto con una longitud de 7.7 km y echado al suroeste (Núñez-Silva, 2020). Hacia la parte sur de área de estudio únicamente se tienen documentadas dos fallas NW-SE, de las cuales sólo la falla Shei corta la litología mesozoica. Esta falla tiene una longitud de 3 km y un echado al suroeste.
- Metodología y toma de muestras
Los afloramientos mesozoicos fueron agrupados en tres zonas estructurales (Figura 3): a) zona Juriquilla, incluye los afloramientos al norte de la ciudad de Querétaro; b) zona San Miguel de Allende, incorpora afloramientos entre los poblados de Comonfort y Los Guía Guanajuato, dentro de la falla San Miguel de Allende; c) zona Sierra de los Cuarzos, contiene los afloramientos de la sierra del mismo nombre entre los poblados de El Arenal, Charape de los Pelones, Puerto Nieto y La Calera. En cada zona se midieron el rumbo y el echado de estratificación, clivaje, plano axial de pliegues, fallas y fracturas. El sentido de las fallas fue determinado a través de estrías, movimiento relativo de los estratos, y pliegues de arrastre. De igual forma las estructuras sigmoidales ayudaron a indicar el sentido del movimiento entre capas. Todos los datos estructurales son presentados en redes estereográficas que se proyectan en el hemisferio inferior. Para obtener la orientación de los esfuerzos principales compresivos se utilizó los datos de las estrías medidas en planos de falla, así como en desplazamiento entre capas. Para establecer el sentido del desplazamiento en las estrías se buscaron escalones de estría. El análisis de las estrías se realizó en el programa Win-Tensor (Delvaux, y Sperner, 2003).
De acuerdo con las observaciones en campo y muestras de mano se colectaron dos muestras de entre 5-8 kg de arenisca para determinar la edad de las sucesiones sedimentarias deformadas. Las dos muestras fueron colectadas en horizontes sedimentarios más arenosos de la unidad vulcanosedimentaria. Son nombradas LN-01 (20°42’24.2” N, 100°28’37.5” O) y SMA-01 (20°53’58.2” N, 100°44’38.6” O), ubicadas en Juriquilla y San Miguel de Allende, respectivamente. De cada muestra se obtuvieron 100 granos de circón detrítico a través de las técnicas estándar. Para obtener edades de U-Pb, los granos fueron analizados por ablación láser asociado a un espectrómetro de masas de plasma acoplada inductivamente (LA-ICP MS del inglés: laser ablation-inductively coupled plasma-mass spectrometry). Los análisis se hicieron en el Laboratorio de Estudios Isotópicos (LEI) del Centro de Geociencias, UNAM, de acuerdo con la metodología descrita por Solari et al. (2018). Las relaciones isotópicas que se usaron fueron 206Pb/238U para granos con una edad menor de 1 Ga y, 207Pb/206Pb para circones con edades mayores de 1 Ga. Los datos fueron reducidos de acuerdo con el procedimiento de Solari et al. (2010) y son mostrados en los anexos como tabla 1 y 2 (Paton et al., 2010; Petrus y Kamber, 2012).Para descartar el uso de componentes de edad U-Pb sin significado geológico, los análisis con discordancia >20% o discordancia inversa >5% fueron eliminados y no se consideran en nuestras interpretaciones. Los granos concordantes se graficaron como funciones de distribución de probabilidad utilizando el software Isoplot (Ludwig, 2012). La edad máxima de depósito (MDA) de cada muestra se interpretó a partir de la media ponderada del conjunto de granos con las edades más jóvenes y concordantes que se traslapan con un error analítico 2σ (Dickinson y Gehrels, 2009) (Anexo tabla 1 y 2).
La unidad vulcanosedimentaria está caracterizada por una intercalación de arenisca, lutita y en menor proporción caliza. Las capas de arenisca tienen gran extensión lateral y presentan gradación normal, laminación planar-paralela, estratificación cruzada, por lo que esta unidad se interpreta como turbiditas. Si bien las muestras fueron colectadas de los horizontes más arenosos, no fue posible determinar de qué parte de la columna corresponden las muestras.
Por su parte, la unidad calcárea corresponde a una intercalación de capas delgadas de caliza, marga y lutita, algunos estratos presentan bandas de pedernal. Adicionalmente, se pueden observar intercalaciones de estratos masivos de calizas con espesores de 1 a 1.5 m. al sureste del poblado Los Guía en la parte norte de la zona San Miguel de Allende. El contacto entre estas dos unidades es transicional y se observa en una barranca al sureste de Los Guía.
- Geocronología y edad de las muestras analizadas
La muestra LN-01 corresponde a una arenisca mediana mal clasificada, soportada por grano, con contactos dominantemente cóncavos y largos. Los granos son angulosos a subangulosos y están dominados por fragmentos líticos de caliza, líticos volcánicos felsíticos y cuarzo monocristalino. La muestra contiene un grupo de 3 circones de entre 457.3 Ma, y 261.9 Ma, el resto de los circones se encuentran en un intervalo de edad comprendido entre 137.1 Ma y 107.8 Ma. Se pueden distinguir dos picos principales, uno a 125 Ma y el segundo a 112 Ma (Figura 4a). La edad máxima de depósito (MDA) es 110.2 ± 0.8, Ma (Albiano temprano) calculada mediante la media ponderada (MSWD) de los 17 granos más jóvenes. La edad es consistente con la edad del grano más joven y la edad del pico más joven (Figura 4a).
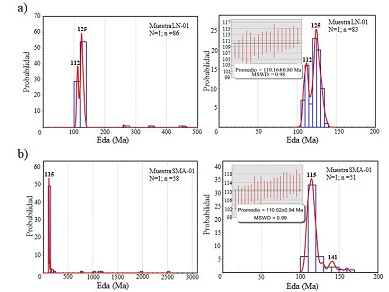 |
| Figura 4. Gráficas de densidad de probabilidad de las edades U-Pb en granos de circón detrítico. La columna de la izquierda muestra la distribución de las edades de todos los granos analizados y la columna de la derecha incluye la distribución de las edades menores a 200 Ma. N = número de muestras; n = número de análisis.: a) Muestra LN-01: se observan dos picos principales a ~125 y ~112 Ma. La edad máxima de depósito es de 110.16 ± 0.80 Ma, calculada a partir de las medias ponderadas (MSWD) de los 17 granos más jóvenes (recuadro gris). b) Muestra SMA-01: al lado izquierdo se distinguen un pico principal a 115 Ma. La edad máxima de depósito es de 110.52 ± 0.94 Ma, calculada a partir de las medias ponderadas (MSWD) de los 21 granos más jóvenes (recuadro gris). |
La muestra SMA-01 corresponde a una arenisca mediana moderadamente clasificada, soportada por grano con contactos dominantemente largos. La muestra contiene seis granos de circón en un intervalo de edad de 2,514 a 207 Ma, el resto de los granos se encuentran en una edad comprendida entre 160.2 Ma y 102.4 Ma. Se distingue un pico principal a los 115 Ma y uno menor a 141 Ma (Figura 4b). La MDA es 110.5 ± 0.9 Ma (Albiano temprano) calculada mediante la media ponderada (MSWD) de los 21 granos más jóvenes. La edad es consistente con la edad del grano más joven y del pico más joven (Figura 4b). Las edades U-Pb obtenidas en granos de circón detrítico nos permiten asignar una edad de Albiano temprano para las muestras LN-01 y SMA-01.
- Deformación contractiva en rocas mesozoicas del área de estudio
5.1. ZONA JURIQUILLA
En la zona de Juriquilla las rocas sedimentarias cretácicas presentan deformación contractiva a escala de afloramiento, se caracteriza por pliegues, fallas inversas y un clivaje axial penetrativo. Los datos estructurales se visualizan en dos grupos que presentan vergencias diferentes (Figura 5a). En la figura 5b, los datos de estratificación muestran dos rumbos promedio diferentes, uno 009°/53° al E, y otro en 153°/50° al SW. El clivaje muestra dos rumbos promedio diferentes: 031°/53° al SE y 189°/64° al WNW. Los planos axiales de los pliegues presentan un rumbo promedio de 028°/38° al SE. Para fallas inversas se presentan dos rumbos promedio diferentes: 358°/54° al E y 140°/29° al SW.
Los pliegues se observan principalmente en la parte oriental de la zona Juriquilla, son isoclinales a abiertos del tipo chevron (Figuras 5c y 5d). Debido a que el espesor de los estratos más competentes es constante en todo el pliegue, se clasifican como pliegues paralelos. Además, estos pliegues presentan deformación por buckling de deslizamiento flexural, que se evidencia por desplazamiento entre capas de los flancos y la geometría de las charnelas en los pliegues (Hudleston y Treagus, 2010). No obstante, estructuras tipo sigma también ponen en evidencia deformación por una zona de cizalla subhorizontal con dirección de transporte al oeste-noroeste (Figura 5e). Contenidos entre capas competentes sin deformar se observan pliegues secundarios (Figura 5f). La mayoría de los pliegues secundarios tienen geometría del tipo S en la parte oriental. Para la parte occidental existen pocos pliegues, sin embargo, los que se observan en perfil tienen geometría del tipo Z.
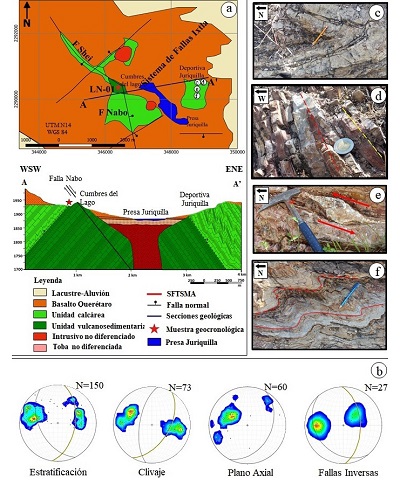 |
| Figura 5. Datos estructurales en la zona Juriquilla. a) Mapa y sección geológica en la zona Juriquilla. b) Red estereográfica de los eventos contractivos, la proyección de los datos es en el hemisferio inferior. Todos los datos están representados en diagramas de densidad de polos; N= número de muestras. Estratificación dos planos principales 009°/53° al E, 153°/50° al SW. Clivaje dos planos principales 031°/53° al SE y 189°/64° al W. Plano axial de los pliegues 026°/40° al SE. Fallas inversas dos planos principales 358°/54° al E y 140°/29° al SW. c) Pliegue Chevron en la parte oriental de Juriquilla (foto tomada en planta). d) Pliegue isoclinal en la parte oriental de Juriquilla, su plano axial (línea roja) es casi paralela a la estratificación (línea amarilla), con vergencia al oeste (foto tomada en perfil). e) Estructura sigma que denota desplazamiento entre capas en la parte oriental de Juriquilla (foto tomada en perfil). f) Pliegues parásitos del tipo S en la parte oriental de Juriquilla (foto tomada en planta). |
5.2. ZONA SAN MIGUEL DE ALLENDE
Con base en nuestras observaciones en campo y los datos publicados, pudimos construir dos secciones geológico-estructurales en la zona San Miguel de Allende. La sección A-A’ propone que el contacto entre las unidades mesozoicas es una zona de cizalla con vergencia al suroeste (Figura 6a). Esto de acuerdo con la extrapolación a profundidad de la sección geológica presentada por Nieto-Samaniego et al. (1999b). Por su parte, la sección B-B’ muestra la deformación de las unidades mesozoicas en la parte norte de San Miguel de Allende. Esta sección se construyó a partir de una caliza masiva que se utilizó como horizonte base para la construcción de un pliegue con vergencia al WSW (Figura 6a). En general, la deformación de las rocas sedimentarias se caracteriza por fallas inversas y algunos pliegues. Presentan una estratificación con un rumbo promedio de 302°/19° al NE. El clivaje de plano axial tiene un rumbo promedio de 308°/08° al NE. Por otro lado, las fallas inversas presentan un rumbo promedio de 325°/29° al NE con dirección de transporte tectónico hacia el suroeste (Figura 6b).
La deformación contractiva de las rocas cretácicas de la parte central de la zona San Miguel de Allende se observa principalmente en el escarpe de la falla del mismo nombre. Para las capas competentes, el espesor de las capas plegadas se mantiene constante, por lo que se clasifican como pliegues paralelos, en las capas incompetentes se observa clivaje de crenulación. Se observa deformación en las vetas contenidas en los estratos plegados (Figura 6c). Hacia la parte sur de la zona San Miguel de Allende también se observan pliegues paralelos (Figura 6d), así como pliegues con una morfología similar a los pliegues secundarios tipo S (Figura 6e).
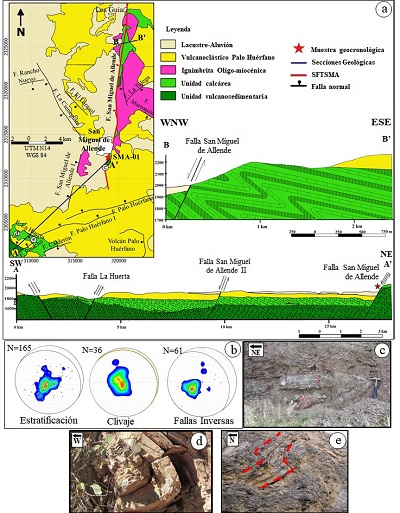 |
| Figura 6. Datos estructurales en la zona San Miguel de Allende. a) Mapa y secciones geológicas de la zona San Miguel de Allende (modificado de Núñez-Silva, 2020). STSMA, Sistema de Fallas Taxco-San Miguel de Allende b) Red estereográfica de los eventos contractivos, la proyección de los datos es en el hemisferio inferior. Todos los datos están representados en diagramas de densidad de polos; N= número de muestras. Estratificación promedio: 302°/19° al NE. Clivaje promedio: 308°/08° al NE. Fallas Inversas promedio: 325°/27° al NE. c) Pliegue paralelo en el escarpe de la falla San Miguel de Allende, las líneas rojas indican la deformación de las vetas cuya geometría es indicativa del desplazamiento entre capas (foto tomada en perfil). d) Pliegue paralelo en la parte sur de San Miguel de Allende (foto tomada en perfil). e) Plegamiento tipo S en la parte sur de San Miguel de Allende (foto tomada en perfil). |
5.3. ZONA SIERRA DE LOS CUARZOS
En la zona de Sierra de los Cuarzos las rocas sedimentarias están afectadas por fallas inversas y algunos pliegues (Figura 7a). Las rocas sedimentarias presentan estratificación con un rumbo promedio 044°/12° al SE (Figura 7b). El clivaje axial tiene un rumbo promedio 000°/27° al E. Mientras que las fallas inversas presentan un rumbo promedio 300°/35° al NE que indica una dirección de transporte tectónico al SW. La estratificación y el clivaje de la zona Sierra de los Cuarzos muestran una mayor dispersión. Esto puede ser producto de la deformación extensional cenozoica que pudo rotar la estratificación y clivaje, así como la interacción de más de un evento de deformación contractivo o deformación sin-sedimentaria. Más adelante se retoma este punto
En la parte central de la Sierra de los Cuarzos se localiza la cabalgadura Encino Rizudo (Figura 7c). Esta cabalgadura es la estructura contractiva más grande documentada en el área de estudio, presenta un rumbo general NW-SE con una vergencia al SE (Gámez-Ordaz y Ávila-Ramos, 2017). A pesar de que no se observa un plano de falla bien definido, se observa una gran zona de falla (aproximadamente 20 m) y brecha de falla (Figura 7d). Hacia la parte oriental de la Sierra de los Cuarzos se pueden observar fallas inversas en la unidad vulcanosedimentaria (Figura 7e). Además, se observan estructuras boudinage (esto de acuerdo con la geometría que presentan los extremos de los boudinage) en las rocas cretácicas de la unidad calcárea (Figura 7f). Estas estructuras tienen un rumbo 173°/34° al W.
 |
| Figura 7. Datos estructurales en la zona Sierra de los Cuarzos. a) Mapa y sección geológica de la zona Sierra de los Cuarzos (modificado de García-Palacios, 2013). b) Red estereográfica de los eventos contractivos, la proyección de los datos es en el hemisferio inferior. Todos los datos están representados en diagramas de densidad de polos; N= número de muestras. Estratificación promedio 044°/12° al SE. Clivaje plano promedio 000°/27° al E. Fallas inversas plano promedio: 311°/34° al NE. c) Cabalgadura Encino Rizudo, fotografía tomada desde el bloque cabalgado, la línea punteada indica la orientación de la cabalgadura que no se ve en la fotografía. d) Brecha de falla en la zona de falla de la cabalgadura Encino Rizudo (foto tomada en planta). e) Fallas inversas NNW-SSE en rocas mesozoicas de la unidad inferior en la parte central de Sierra de los Cuarzos indican una vergencia al oeste-noroeste (foto tomada en perfil). f) Estructuras boudinage en rocas mesozoicas de la unidad calcárea en la parte noreste de Sierra de los Cuarzos Los estratos que envuelven estas estructuras tienen un rumbo: 173°/34° al W (foto tomada en planta). |
- Discusión
6.1. CORRELACIONES DE LAS UNIDADES VULCANOSEDIMENTARIA Y CALCÁREA
De acuerdo con las edades U-Pb obtenidas en granos de circón y la posición estratigráfica, los depósitos de la unidad vulcanosedimentaria de las áreas de San Miguel de Allende y Juriquilla esta unidad se correlaciona con la Formación Pelones descrita por Palacios-García (2013) y Palacios-García y Martini (2014). En consecuencia, los depósitos que le sobreyacen y pertenecen a la unidad calcárea se correlacionan en parte con las rocas de la Formación Españita que afloran en la Sierra de los Cuarzos (Palacios-García, 2013; Palacios-García y Martini, 2014). Debido a la complejidad estructural de las zonas de estudios la posición estratigráfica de las muestras es imprecisa, pero las edades obtenidas tienen implicaciones importantes. Para el área de San Miguel de Allende la edad obtenida concuerda con lo reportado por varios autores (Quintero-Legorreta, 1992; Ortiz-Hernández, et al., 2003). La edad de los depósitos estudiados indica que la unidad vulcanosedimentaria y la unidad calcárea no son parte de la cuenca de antepaís que se desarrolló adyacente al Orógeno Mexicano. Los componentes de edad del Cretácico Tardío que caracterizan a los estratos de la cuenca de antepaís mexicana están ausentes en las muestras analizadas (Fitz-Díaz, et al., 2018; Juárez-Arriaga et al., 2019b) y sustentan nuestra interpretación. Por lo tanto, ambas unidades fueron deformados posteriormente debido al avance hacia el noreste de la cuña orogénica durante el Cretácico Tardío-Paleógeno (Martini et al. 2012; Palacios-García y Martini, 2014; Fitz-Diaz et al., 2018; Juárez-Arriaga et al., 2019b).
Las edades U-Pb obtenidas limitan la edad del evento de deformación que afectó a dichas rocas. Ya que la edad de depósito es ca. 110 Ma, el evento de deformación tiene que ser más joven, y posiblemente está relacionado con la formación del Orógeno Mexicano. Con esto se descarta una relación con la sutura del terreno Guerrero en el área de San Miguel de Allende y Juriquilla. Esto debido a que la sutura del Terreno Guerrero es previa al depósito de la Caliza La Perlita, es decir, antes de 113 Ma (Martini et al., 2013).
Para el área Sierra de los Cuarzos Palacios-García (2013), y Palacios-García y Martini (2014) obtuvieron edades de depósito de las unidades mesozoicas más antiguas a las reportadas en este trabajo. Las formaciones Sierra de los Cuarzos (155.9 Ma) y Pelones (127.8 Ma) reportan edades de depósito previas o contemporáneas a la acreción del Terreno Guerrero. Esto, aunado con la gran cantidad de fallas cenozoicas, podría explicar el porqué de la gran dispersión de los datos estructurales colectados en esta área.
6.2. EVENTOS DE DEFORMACIÓN COMPRESIVOS
Las rocas mesozoicas más antiguas se localizan en la parte central de Sierra de los Cuarzos, donde también se localiza la cabalgadura Encino Rizudo con rumbo promedio NE-SW (Figura 7c). A pesar de que esta cabalgadura tiene una orientación ortogonal a la acreción del Terreno Guerrero o a la formación del Orógeno Mexicano, Martini et al. (2013) documentan un evento con una orientación y vergencia similar en el área de Guanajuato asociado a la acreción del Terreno Guerrero. Estos autores consideran que la acreción sucede en un cinturón de sutura complejo, el cambio en la dirección del transporte tectónico se debe a la geometría compleja del cinturón. A finales de la acreción en zonas locales, este cinturón presenta cambios en la cinemática con respecto a la dirección de transporte regional. De acuerdo con la orientación y la dirección de transporte de la cabalgadura Encino Rizudo, así como la edad de las rocas que corta, se podría considerar que esta cabalgadura corresponde a un primer evento (D1) que ocurrió a finales de la acreción del Terreno Guerrero. Este evento afectó a las rocas más antiguas de la Sierra de los Cuarzos
El segundo evento D2 es evidenciado por las fallas inversas en San Miguel de Allende y Sierra de los Cuarzos (Figuras 6b y 7b), así como los contactos cizallados entre las unidades mesozoicas al sur de San Miguel de Allende (Nieto-Samaniego et al., 1999b) y al oriente de Sierra de los Cuarzos (Palacios-García, 2013; Palacios-García y Martini, 2014). Las fallas inversas presentan un rumbo promedio general NW-SE y los contactos cizallados muestran una dirección de transporte tectónico al SW. El evento D2 está limitado por la edad de depósito de la unidad vulcanosedimentaria (110 Ma) obtenida en Juriquilla y San Miguel de Allende. Ya que la deformación es contemporánea o posterior al depósito, el evento D2 es posterior a la acreción del Terreno Guerrero. De esta forma, la Sierra de los Cuarzos está afectada por dos eventos contractivos: D1, manifestada por la cabalgadura Encino Rizudo con rumbo NE-SW y vergencia al SE. D2, manifestado por las fallas inversas con rumbo NW-SE y vergencia la SW. Por su parte, en Juriquilla y San Miguel de Allende se observa sólo el evento D2 evidenciado por fallas inversas con rumbo NW-SE.
Un método menos ambiguo para identificar el eje de máxima compresión es a través de las estrías de fallas. Para ello se colectaron datos de estrías formadas en planos de fallas inversas, así como formadas por el desplazamiento entre capas (Figura 8). Mediante el cálculo de diedros en el programa Win-Tensor (Delvaux, y Sperner, 2003) se observa que, en la mayoría de los afloramientos, el eje de máxima compresión tiene una orientación NNE-SSW que es similar a la dirección de transporte tectónico estimada mediante las fallas inversas.
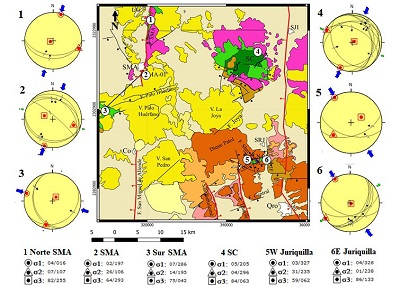 |
| Figura 8. Paleoesfuerzos de la zona de estudio. La mayoría de los esfuerzos muestran que el eje de máxima compresión (σ1) tiene una orientación NNE-SSW. Cada estereograma contiene a las estrías de los diferentes puntos de muestreo: 1 Norte SMA, parte norte de San Miguel de Allende; 2 SMA, parte central de San Miguel de Allende; 3 Sur SMA, parte sur de San Miguel de Allende; 4 SC, parte oriental de Sierra de los Cuarzos; 5 W Juriquilla, parte occidental de Juriquilla; 6 E Juriquilla, parte oriental de Juriquilla. Para el área de Juriquilla y al sur de San Miguel de Allende las estrías muestran el desplazamiento entre capas, por lo que el desplazamiento se encuentra contenido dentro del plano de estratificación. Los planos negros corresponden a los planos que contienen a las estrías. La simbología y abreviaturas son la misma que en la figura 3. |
En el sur de San Miguel de Allende y en el área de Juriquilla, el eje de máxima compresión tiene orientaciones diferentes (Figura 8). Los modelos de Juriquilla difieren del resto debido a que las estrías se formaron principalmente por el desplazamiento entre capas. De esta forma, el desplazamiento se encuentra limitado por el plano de estratificación que contiene a la estría. El estado de esfuerzos obtenido a partir del desplazamiento entre capas en el lado occidental de Juriquilla muestra desplazamiento lateral derecho. Por su parte, el estado de esfuerzos obtenido en el lado oriental de Juriquilla muestra desplazamiento lateral izquierdo. Por lo tanto, los estereogramas medidos en Juriquilla muestran desplazamiento lateral, que no necesariamente implica fallamiento lateral, puesto que el desplazamiento se contuvo entre capas. Si bien el SFTSMA en el área de estudio no presenta reportes de fallamiento lateral, autores como Alaniz-Álvarez et al. (2002b), Tristán-Gonzáles et al. (2009), Aranda-Gómez y McDowell (1998) y Botero-Santa et al. (2015) han documentado fallamiento lateral para el centro de México. De igual forma las relaciones angulares entre el clivaje y la estratificación muestran desplazamientos laterales tanto en la parte oriental, como occidental del área Juriquilla. Otra hipótesis que podría explicar este cambio en la orientación del eje de máxima compresión en Juriquilla y sur de San Miguel de Allende podría corresponder a un posible tercer evento de deformación, esto podría explicar la existencia de algunos planos axiales de pliegues ortogonales al eje de máxima compresión NNE-SSW. No obstante, estos pliegues corresponden a pliegues pequeños formados en los estratos menos competentes, además en campo no se observa ninguna otra evidencia sobre este tercer evento. Podría ser el inicio de un tercer evento, no obstante, el evento no pliega estratos más competentes ni forma fallas inversas con rumbo NW-SE.
Datos de fechamiento de deformación por K-Ar realizadas en micas blancas sobre una zona de cizalla en rocas del Cretácico Superior dentro de la Sierra de los Cuarzos sugieren un rango de edad de la deformación de entre 82 y 79 Ma (Martini et al., 2016). Este rango de edad es congruente con edades de deformación obtenidas en rocas del Mesozoico que afloran en el área de Tolimán (Fitz-Díaz et al., 2014; Garduño-Martínez et al., 2015; Guerrero-Paz et al., 2020). Adicionalmente, en el área de Mineral de Pozos, se han reportado edades de exhumación ZHe en un rango de 66 Ma y 55 Ma (Juárez-Arriaga et al., 2019b). Si bien, la edad de depósito ayuda a establecer un límite para la edad de la deformación, es recomendable obtener la edad de deformación de las unidades cretácicas de San Miguel de Allende y Juriquilla. Esto para diferenciar si la deformación es contemporánea al depósito o si pertenece a algún evento reportado de hace ~80 Ma, al de 66-55 Ma o ambos.
6.3. DIRECCIÓN DE TRANSPORTE TECTÓNICO DEL EVENTO D2
Para determinar la dirección de transporte tectónico del evento D2, se utilizaron relaciones angulares entre clivaje y estratificación, orientación de fallas inversas y vergencia de pliegues. El rumbo de las fallas inversas muestra que el eje de máxima compresión tiene una orientación aproximada NE-SW. La dirección de transporte tectónico es al SW que se evidencia mediante los contactos cizallados de las rocas mesozoicas que se observan en San Miguel de Allende y Sierra de los Cuarzos (Nieto-Samaniego et al., 1999b; Palacios-García, 2013; Palacios-García y Martini, 2014).
La vergencia de los pliegues es otra manera para determinar la dirección de transporte tectónico, en el área de estudio el ejemplo más claro corresponde a los pliegues formados en la sección B-B’ del área de San Miguel de Allende, ahí la dirección de transporte tectónico es al WSW. Los datos estructurales medidos en Juriquilla igual sugieren la presencia de un gran pliegue, los datos de clivaje y estratificación pueden ser interpretados como dos flancos de un pliegue regional, del cual se puede obtener la vergencia y con ello la dirección de transporte tectónico para el área de Juriquilla.
La estratificación y el clivaje en San Miguel de Allende y Sierra de los Cuarzos presentan datos muy dispersos (Figuras 6b y 7b). La dispersión de estos datos puede ser producto de: a) La rotación de los datos estructurales debido a extensión cenozoica manifestada en los tres diferentes sistemas de fallas normales; b) dos eventos de acortamiento en una orientación casi ortogonal , y c) deformación sinsedimentaria ocurrida durante el depósito de las unidades mesozoicas, esto principalmente se observa en el área de Sierra de los Cuarzos donde se localizan las rocas más antiguas y existen reportes de deformación sinsedimentaria (Palacios-García, 2013; Palacios-García y Martini, 2014). De igual forma hay que considerar la distribución espacial de los datos estructurales tomados, esto está limitado a los pocos afloramientos del Mesozoico principalmente en San Miguel de Allende y Juriquilla, donde las rocas mesozoicas son expuestas por el fallamiento normal cenozoico. Las fallas cenozoicas que exponen a las rocas mesozoicas de igual forma pudieron modificar la cinemática de la deformación mesozoica.
Como se ha mencionado previamente, la cinemática de la deformación compresiva mesozoica está influenciada por la deformación cenozoica. Sin embargo, es complicado estimar cuánto ha sido modificado. Un ejercicio efectivo para rotar los datos y con ello restaurar la cinemática de la deformación mesozoica es volver a la horizontal los estratos depositados inmediatamente sobre las rocas mesozoicas. No obstante, sólo en el área de Juriquilla se realiza rotaciones de los datos estructurales mesozoicos, ya que en las demás zonas sobre la litología mesozoica no existe depósito o fue erosionado. Para realizar la rotación, se utilizaron como ejes de rotación el rumbo de una pseudo-estratificación (245°/16° al SE) del Basalto Querétaro para el flanco occidental y; el contacto entre un basalto y una toba (336°/20° al SW) para el flanco oriental. Debido a esta rotación el flanco oriental del pliegue regional tiene un rumbo 13° con echado de 37.5° al E; mientras que el flanco occidental tiene un rumbo promedio de 136.5° con un echado de 53° al SW (Figura 9). El plano axial del pliegue regional se calcula a partir del ángulo bisector medido entre ambos flancos (Figura 9). El plano axial tiene un rumbo de 341° y un echado de 80° al ENE (Figura 9, plano azul). De acuerdo con el plano axial del pliegue regional se establece una dirección de transporte tectónico al WSW.
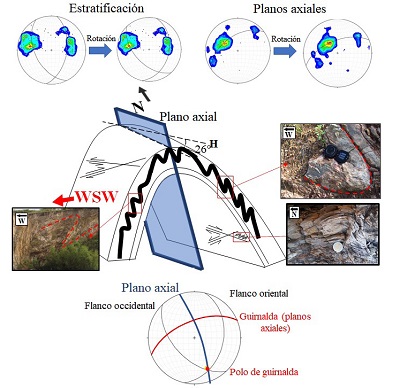 |
| Figura 9. Representación esquemática del pliegue regional o anticlinorio de la zona Juriquilla. El pliegue fue rotado usando como eje de rotación la litología subyacente depositada sobre la litología cretácica de cada flanco. En la parte superior se observan los estereogramas de la estratificación y planos axiales sin rotar y rotados. El plano axial resultante de la rotación (341°/80° al NE) indica una dirección de transporte tectónico hacia el WSW. En su flanco oriental se observan pliegues secundarios con geometría S que apoyan la geometría del pliegue, en las capas menos competentes se desarrolla clivaje de crenulación. En el flanco occidental se observan algunos pliegues con geometría Z. Al graficar todos los polos de los planos axiales se forma una guirnalda, por lo que se considera que todos los pliegues forman parte de una estructura regional mayor (anticlinorio). El estereograma inferior muestra que el plano axial (color azul) es ortogonal a la guirnalda (plano rojo) formada de los polos del plano axial. |
De igual forma, los polos de los planos axiales de los pliegues secundarios forman una guirnalda cuyo plano tiene un rumbo 235°/52° (Figura 9). Este plano es casi ortogonal al plano axial del pliegue regional formado a partir de los datos de estratificación, por lo que se podría considerar que todos pliegues medidos en la zona Juriquilla forman parte de un anticlinorio (Figura 9). El anticlinorio tendría una orientación NE-SW y de acuerdo con su plano axial, tendría una vergencia al WSW.
Otro aspecto que ayuda a determinar la dirección de transporte tectónico es el clivaje medido en ambos flancos del anticlinorio. Para este análisis también fueron rotados los datos de clivaje. En el flanco occidental se observa un clivaje axial casi paralelo a la estratificación; para el flanco oriental además del clivaje axial, se observa clivaje de crenulación en estratos delgados menos competentes. El clivaje de crenulación se puede desarrollar durante un evento continuo de plegamiento como lo es la cizalla simple (Viola y Mancktelow, 2005). Durante la cizalla simple el clivaje rotará en el mismo sentido que la cizalla, y el flanco opuesto al sentido de la cizalla desarrollará un clivaje opuesto (clivaje de crenulación). Debido a que el clivaje de crenulación únicamente se observa en el flanco oriental, el sentido de la cizalla será hacia el WSW que coincide con lo reportado en San Miguel de Allende y Sierra de los Cuarzos reportado en este trabajo.
Si bien nuestros datos son contrarios a la dirección de transporte tectónico del Cinturón de Pliegues y Cabalgaduras Mexicano (CPCM; Fitz-Díaz et al., 2012; Vásquez-Serrano et al., 2018; 2019), varios autores han documentado resultados similares en la parte más distal de la cuña del orógeno (Cabral-Cano et al., 2000; Salinas-Prieto et al., 2000; Fitz-Díaz et al., 2008; Martini et al., 2013; Palacios-García y Martini, 2014). En la parte sur del SFTSMA también se ha observado una dirección de transporte tectónico al SW (Cabral-Cano et al., 2000; Salinas-Prieto et al., 2000; Fitz-Díaz et al., 2008). En la Sierra de los Cuarzos las unidades mesozoicas más jóvenes también han reportado una dirección de transporte tectónico al SW (García-Palacios y Martini, 2014; Martini et al., 2016).
Una vez establecida la dirección de transporte tectónico en el área de estudio y observando que otros autores han documentado una dirección de transporte similar sobre el SFTSMA (Cabral-Cano et al., 2000; Salinas-Prieto et al., 2000; Fitz-Díaz et al., 2008), se prosigue a comparar nuestros datos con áreas adyacentes. Hacia la parte oriental, Fitz-Díaz et al. (2012) realizan un perfil geológico-estructural sobre el CPCM cuyo punto más occidental corresponde a la secuencia Tolimán a ~80 km al oriente de Juriquilla (Figura 1). En Tolimán se observa que la dirección de transporte tectónico es hacia el NE (Fitz-Díaz et al., 2012; 2018). Por su parte, el trabajo de Reyes-Reyes y Luna-Castro (1998) muestra que en el área de Mineral de Pozos (a ~30 km al norte de Sierra de los Cuarzos, figura 1) el contacto entre las unidades cretácicas es una zona de cizalla con dirección de transporte tectónico hacia el NE.
En el área de Guanajuato Martini et al. (2013) documentan pliegues y cabalgaduras en unidades mesozoicas. Se reportan diferentes direcciones de transporte tectónico asociadas a la acreción del Terreno Guerrero sobre el núcleo continental (Martini et al., 2013). Sin embargo, la cabalgadura más joven que afecta a las unidades del Cretácico Superior presenta una dirección de transporte tectónico al SW, similar a la documentada en este trabajo (Martini et al., 2013). Estos autores proponen que las variaciones en la dirección del transporte tectónico corresponden a eventos locales.
De acuerdo con lo documentado en este trabajo y lo documentado por otros autores, hacia el oriente del área de estudio se tiene una dirección de transporte tectónico hacia el noreste. Mientras que del área de estudio hacia el occidente se reporta una dirección de transporte tectónica hacia el suroeste. Este cambio no es tan marcado, y se podría limitar a un alcance local; sin embargo, esta dirección de trasporte tectónico está reportada en varios puntos al sur del área de estudio dentro del SFTSMA. Algunas hipótesis del porque existe un cambio en la dirección del transporte tectónico se presentan en la sección 6.4 de la discusión.
6.4. MECANISMOS DE VERGENCIA DE LA DIRECCIÓN DEL TRANSPORTE TECTÓNICO
La dirección de transporte observada en la mayoría de los afloramientos en este trabajo coincide con datos de otros autores (Salinas-Prieto et al., 2000; Cabral-Cano et al., 2000; Fitz-Díaz et al., 2008; Palacios-García, 2013; Palacios-García y Martini, 2014). El cambio en la dirección de transporte tectónico ocurre en la margen occidental del Orógeno Mexicano, donde el SFTSMA actúa como límite. La explicación del cambio en la dirección de transporte no es trivial, necesita un trabajo más extenso de análisis cinemático y estimación de la deformación, así como modelado numérico y/o analógico.
Sin embargo, si se toman en cuenta algunas consideraciones como las condiciones mecánicas del modelo de la cuña crítica, es posible que el cambio en la dirección de transporte se deba a efectos de retrodeformación. El modelo de la cuña orogénica ha sido usado para explicar las variaciones en la deformación de las rocas sedimentaras en la parte central del CPCM. Esta hipótesis se basa en la posición de las rocas del área de estudio dentro de la cuña crítica propuesta por Fitz-Díaz et al. (2012). En la zona de traspaís suele existir un acomodo de la deformación mediante retrodeformación durante el desarrollo de una cuña orogénica (Davis et al., 1983; Dahlen et al., 1984; Dahlen y Barr, 1989; Dahlen, 1990). De esta forma las estructuras que se forman más alejadas del frente de la cuña orogénica son estructuras de alto ángulo y presentan una vergencia opuesta a la dirección de la cuña (Figura 10b). No obstante, en el área de estudio sólo en la parte oriental del área Juriquilla y en algunas fallas del sur de San Miguel de Allende se observan fallas inversas de alto ángulo.
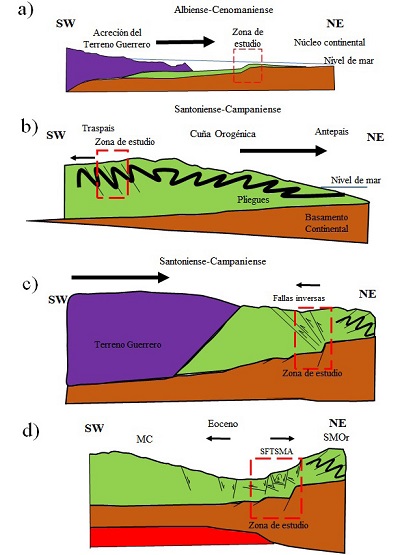 |
| Figura 10. Posibles modelos para explicar el cambio en la dirección del transporte tectónico en el Orógeno Mexicano. Los recuadros rojos indican la localización del área de estudio. a) Zona de estudio previo a la formación del Orógeno Mexicano. b) Modelo de retrodeformación en la cuña orogénica, en el Traspaís, la parte más alejada de la cuña, se forman fallas inversas con vergencia opuesta a la dirección de transporte de la cuña orogénica. c) Modelo que propone la existencia de un desnivel paleogeográfico dentro del área de estudio que pudo generar patrones estructurales con vergencias opuestas en la parte oriental y occidental del desnivel. Este desnivel pudo ser producto de un límite cortical formado previo a la formación del Orógeno Mexicano. d) Para el Eoceno la extensión cenozoica genera fallas normales (sintéticas y antitéticas) que rotan y basculan la cinemática de las estructuras mesozoicas; estas fallas normales pueden cambiar el alto ángulo que presentan las fallas inversas con vergencia opuesta generadas durante el Santoniense-Campaniense. Dichas fallas extensivas cenozoicas están representadas por el Sistema de Fallas Taxco-San Miguel de Allende (SFTSMA) y se localizan sobre el antiguo desnivel paleogeográfico. |
Una segunda hipótesis está relacionada con heterogeneidades en el basamento donde se despegó el paquete sedimentario deformado (Figura 10c). El área de estudio se localiza entre la CMCM y la PVSLP. La zona de estudio también está localizada en la margen oriental de la zona de sutura del Terreno Guerrero y el núcleo continental, y actualmente en el mismo sitio donde se encuentra la zona de falla Taxco-San Miguel de Allende. Esto sugiere que es una frontera cortical reactivada en varios lapsos de la historia geológica del centro de México (Alaniz-Álvarez et al., 2005). Por lo tanto, el SFTSMA podría ser una heterogeneidad cortical, las heterogeneidades corticales ayudan a la localización de la deformación durante un evento orogénico y pueden distorsionar el patrón preferencial del trasporte tectónico (Dixon, 2004; Magaña-Castillo, 2018). Esta heterogeneidad podría estar manifestada a través de un antiguo desnivel topográfico. Este desnivel topográfico fue documentado en calizas de plataforma del Jurásico Superior (Carrillo-Bravo, 1971), y estaría evidenciado por el ambiente marino profundo en que se infiere se depositó la unidad vulcanosedimentaria. Ya que el desnivel se formó previo al Orógeno Mexicano, la deformación se concentraría en la parte superior del desnivel, en los horizontes evaporíticos. Debido a ello, el Orógeno Mexicano se mantendría como un orógeno de piel delgada. Adicionalmente, las rocas cretácicas que presentan una dirección de transporte tectónico opuesta a la del CPCM se localizan sobre o muy cerca del SFTSMA (Salinas-Prieto et al., 2000; Cabral-Cano et al., 2000; Fitz-Díaz et al., 2008; Palacios-García, 2013; Palacios-García y Martini, 2014), lo que apoyaría esta hipótesis.
La deformación cenozoica modifica la cinemática original de la deformación mesozoica. Sin embargo, es complicado determinar la cantidad de rotación o basculamiento de las estructuras contractivas. Inclusive no se puede descartar la idea de que la deformación cenozoica haya basculado las fallas inversas de alto ángulo (Figura 10d). A pesar de que el SFTSMA ha tenido varios periodos de reactivación (Alaniz-Álvarez et al., 2001; 2002a; Alaniz-Álvarez y Nieto-Samaniego, 2005), y es el límite entre la MC y SMOr, existen pocos afloramientos que muestren directamente el contacto entre las rocas sedimentarias mesozoicas y las rocas eocénicas dentro del área de estudio. Cabe mencionar que para el centro del país los basculamientos máximos ocurrieron durante el Eoceno (Aranda-Gómez y Mcdowell, 1998). Además, los rumbos de las capas cenozoicas no son iguales alrededor de la zona mesozoica dentro del área de estudio, por lo que, es difícil analizar la rotación. Por otra parte, la mayoría de las capas cenozoicas del área de estudio tiene echados menores a 20° (Alaniz-Álvarez et al., 2001, Xu et al., 2011; Núñez-Silva, 2020). Si se hace una rotación con estos datos, las rotaciones de las estructuras mesozoicas no variarían lo suficiente para ser consideradas de alto grado. Trabajos como el de Del Pilar-Martínez et al. (2020) documentan inclusive deformación triaxial en la parte norte del área de estudio, lo que dificulta más restablecer los datos mesozoicos. De las tres áreas sólo en el área de Juriquilla analizamos una rotación, la cual cuantifica un poco la variación de los datos mesozoicos afectados por la deformación cenozoica.
Para poder discernir entre estas dos ideas sería conveniente realizar en futuras investigaciones modelos analógicos y/o numéricos considerando cambios laterales reológicos dentro de la cuña crítica. Así como realizar estudios geofísicos como perfiles sísmicos orientados con la misma dirección de transporte (NE-SW) para observar la distribución de los horizontes sedimentarios y su basamento.
- Conclusiones
Entre las localidades de Juriquilla, Querétaro y San Miguel de Allende, Guanajuato se distinguieron dos unidades cretácicas. La unidad inferior denominada informalmente como unidad vulcanosedimentaria, correspondiente una sucesión de arenisca, lutita y caliza, con una edad del Albiano temprano obtenida del fechamiento U-Pb de circón detrítico. La unidad superior denominada informalmente como unidad calcárea, corresponde a una intercalación de areniscas, calizas y lutitas, cuya edad se infiere del Albiano por sus relaciones estratigráficas.
Se identifican dos eventos de deformación contractivos para el área de Sierra de los Cuarzos y un evento de deformación contractivo para las zonas San Miguel de Allende y Juriquilla. El evento D1 observado en las rocas más antiguas de Sierra de los Cuarzos tiene una dirección de transporte tectónico hacia el SE. Por su parte el evento D2 observado en las rocas mesozoicas más jóvenes de Sierra de los Cuarzos y en las rocas mesozoicas de San Miguel de Allende y Juriquilla tienen una dirección de transporte tectónico hacia el SW. La edad de D1 posiblemente sea contemporánea al final de la acreción del Terreno Guerrero. Por su parte, las edades U-Pb permiten establecer un límite en la edad del evento D2, siendo esta menor que 110 Ma.
Por lo anterior, este evento de deformación se podría relacionar con la formación del Orógeno Mexicano. La dirección de transporte tectónico para D1 y D2 en la zona de estudio es diferente a la que se observa en el Cinturón de Pliegues y Cabalgaduras Mexicano. Esta dirección de transporte puede ser producto de retrodeformación, y/o heterogeneidades en el basamento. Para la última hipótesis, el SFTSMA podría funcionar como una heterogeneidad cortical heredada que ayuda a la localización de la deformación durante el evento orogénico. Para el Cenozoico tanto el SFTSMA como otros sistemas de fallas normales rotan y basculan las estructuras contractivas mesozoicas.
Al comparar la dirección de transporte tectónico de áreas adyacentes y más al sur del área de estudio, sobre la traza del SFTSMA se observa que este sistema de fallas corresponde a un parteaguas en la vergencia de la dirección de transporte tectónico del Orógeno Mexicano. Hacia el oriente del SFTSMA la vergencia es hacia el NE. Mientras, hacia el occidente del sistema de fallas la vergencia es hacia el SW. La dirección de transporte opuesta entre cada bloque del SFTSMA brinda un elemento más para que el sistema de fallas sea considerado como un límite cortical.
Contribuciones de los autores
Conceptualización: Alaniz-Álvarez S.A., Cid-Villegas G., Vásquez-Serrano A. Análisis y adquisición de datos: Cid-Villegas G., Vásquez-Serrano A., Xu S-S. Desarrollo metodológico técnico: Vásquez-Serrano A., Xu S-S., Alaniz-Álvarez S.A., Redacción del manuscrito original: Cid-Villegas G. Redacción de manuscrito corregido y editado: Cid-Villegas G., Xu S-S, Vásquez-Serrano A., Alaniz-Álvarez S.A., Juárez-Arriaga E. Diseño gráfico: Cid-Villegas G. Trabajo de Campo: Cid-Villegas G, Vásquez-Serrano A., Xu S-S. Interpretación de datos: Cid-Villegas G. Vásquez-Serrano A., Xu S-S. Financiamiento: Alaniz-Álvarez S.A., Xu S-S. Procesamiento de datos geocronológicos y petrografía de las muestras: Cid-Villegas G., Juárez-Arriaga E.
Financiamiento
El financiamiento de esta investigación fue proporcionado mediante los proyectos PAPIIT IN107219 y IN102919.
Agradecimientos
Los autores agradecen el apoyo de Carlos Ortega Obregón y Luigi Solari del Laboratorio de Estudios Isotópicos (LEI) del Centro de Geociencias de la UNAM en la preparación de muestras para el análisis U-Pb y en la reducción de datos. El primer autor agradece al CONACYT por la beca de posgrado otorgada. De igual forma G. Cid-Villegas agradece a: Erik Medina Romero, Lenin Ivan Valdez Barrera, Andrea Billarent Cedillo, Cecilia Mata, Alexis del Pilar Martínez, Alejandro Rodríguez Trejo y Sheila Irais Peña Corona, por el apoyo en el trabajo de campo y la preparación del manuscrito. Agradecemos los comentarios de los revisores del manuscrito, Eliza Fitz-Díaz y un revisor anónimo, cuyos comentarios enriquecieron este artículo.
Conflicto de intereses
Los autores de este trabajo no presentan ningún conflicto de interés con ningún otro autor, centro de investigación o grupo de trabajo relacionado a la presente investigación.
Referencias
Aguirre-Díaz, G.J., López-Martínez, M., 2001, The Amazcala caldera, Queretaro, Mexico. Geology and geochronology: Journal of Volcanology and Geothermal Research, 111, 203-218. http://doi.org/10.1016/S0377-0273(01)00227-X
Aranda-Gómez, J.J., Mcdowell, F.D., 1998, Paleogene Extension in the Southern Basin and Range Province of Mexico: Syndepositional Tilting of Eocene Red Beds and Oligocene Volcanic Rocks in the Guanajuato Mining District: International Geology Review, 40, 116-134. http://dx.doi.org/10.1080/00206819809465201
Alaniz-Álvarez, S.A., Nieto-Samaniego, Á.F., 2005, El sistema de fallas Taxco-San Miguel de Allende y la Faja Volcánica Transmexicana, dos fronteras tectónicas del centro de México activas durante el Cenozoico: Boletín de la Sociedad Geológica Mexicana, 57, 65-82. https://doi.org/10.18268/bsgm2005v57n1a4
Alaniz-Álvarez, S.A., Nieto-Samaniego, Á.F., Reyes-Zaragoza, M.A., Orozco-Esquivel, M.T., Ojeda-García, A.C., Vasallo-Morales, L.F., 2001, Estratigrafía y deformación de la región San Miguel de Allende-Querétaro: Revista Mexicana de Ciencias Geológicas, 18, 129-148.
Alaniz-Álvarez, S.A., Nieto-Samaniego, Á.F., Orozco-Esquivel, M.T., Vasallo-Morales, L.F., Xu, S.S., 2002a, El Sistema de Fallas Taxco-San Miguel de Allende: Implicaciones en la deformación post-Eocénica del centro de México: Boletín de la Sociedad Geológica Mexicana, 55, 12-29. http://dx.doi.org/10.18268/bsgm2005v57n1a4
Alaniz-Álvarez, S.A., Nieto-Samaniego, Á.F., Morán-Zenteno, D.j., Alba-Aldave. L., 2002b, Rhyolitic volcanism in extension zone associated with strike-slip tectonics in the Taxco region, southern Mexico: Journal of Volcanology and Geothermal Research, 118, 1-14. https://doi.org/10.1016/S0377-0273(02)00247-0
Botero-Santa, P.A., Alaniz-Álvarez, S.A., Nieto-Samaniego, Á.F., López-Martínez, M., Levresse, G., Xu, S., Ortega-Obregón, C., 2015, Origen y desarrollo de la cuenca El Bajío en el sector central de la Faja Volcánica Transmexicana: Revista Mexicana de Ciencias Geológicas, 32, 84-98.
Cabral-Cano, E., Draper, G., Lang, H.R., Harrison, C.G.A., 2000, Constraining the late Mesozoic and early Tertiary tectonic evolution of southern Mexico: structure and deformation history of the Tierra Caliente region, southern Mexico: Journal of Geology, 108, 427-446. http:// doi:10.1086/314414.
Campos-Enríquez, J.O., Kerdan, T., Morán-Zenteno, D.J., Urrutia-Fucugauchi, J., Sánchez-Castellanos, E., Alday-Cruz, R., 1994, Estructura de la litósfera superior a lo largo del Trópico de Cáncer: Geos, Boletín Informativo, Unión Geofísica Mexicana, 12, 75-76.
Carrillo-Bravo, J., 1971, La plataforma de Valles-San Luis Potosí: Boletín de la Asociación Mexicana de Geólogos Petroleros, 23, 1-110.
Cerca-Martínez, L.M., Aguirre-Díaz, G.J., López-Martínez, M., 2000, The geological evolution of the southern Sierra de Guanajuato; a documented example of the transition from the Sierra Madre Occidental to the Mexican Volcanic Belt: International Geology Review, 42, 131-151. https://doi.org/10.1080/00206810009465073
Chiodi, M., Monod, O., Busnardo, R., Gaspar, D., Sanchez, A., Yta, M., 1988, Une discordance ante Albienne datée par une faune d’ámmonites et de braquiopodes de type Téthysien au Mexique Central: Geobios, 21, 125-135.
Cuéllar-Cárdenas, M.A., Nieto-Samaniego, Á.F., Levresse, G., Alaniz-Álvarez, S.A., Solari, L., Ortega-Obregón, C., López-Martínez, M., 2012, Límites temporales de la deformación por acortamiento Laramide en el centro de México: Revista Mexicana de Ciencias Geológicas, 29, 179-203.
Dahlen, F.A., 1990, Critical taper model of fold and thrust belts and accretionary wedges: Annual Reviews Earth Planetary Sciences, 18, 55–99. https://doi. org/10.1146/annurev.ea.18.050190.000415
Dahlen, A., Suppe, J., Davis, D., 1984, Mechanics of fold-and-thrust belts and accretionary wedges: Cohesive coulomb theory: Journal of Geophysical Research, 89, 10087–10101. https:// doi.org/10.1029/JB089iB12p10087
Dahlen, F.A., Barr, T.D., 1989, Brittle frictional mountain building 1: deformation and mechanical energy Budget: Journal of Geophysical Research, 94, 3923–3947. https:// doi.org/10.1029/JB094iB04p03906
Davis, D., Suppe, J., Dahlen, F.A., 1983, Mechanics of fold-and-thrust belts and accretionary wedges: Journal of Geophysical Research, 88, 1153–1172. http://doi:10.1029/JB088iB02p01153
Dickinson, W.R., Gehrels, G.E., 2009, Use of U-Pb ages of detrital zircons to infer maximum depositional ages of strata: A test against a Colorado Plateau Mesozoic database: Earth and Planetary Science Letters, 288, 115-125. http://doi: 10.1016/j.epsl.2009.09.013
Delvaux, D., Sperner, B., 2003, Stress tensor inversion from fault kinematic indicators and focal mechanism data: the TENSOR program, in New Insights into Structural Interpretation and Modelling, D. Nieuwland Ed.: The Geological Society of London, Special Publications, 212, 75-100.
Del Pilar-Martínez, A., Nieto-Samaniego, Á.F., Alaniz-Álvarez, 2020, Development of a brittle triaxial deformation zone in the upper crust: the case of the southern Mesa Central of Mexico: Tectónics, 39, e2020TC006166. https://doi.org/10.1029/2020TC006166
Dixon, J.M., 2004, Physical (centrifuge) modeling of fold-thrust shortening across carbonate bank margins Timing, vergence, and style of deformation, in McClay, K.R., (ed.), Thrust Tectonics and Hydrocarbon Systems: American Association of Petroleum Geologists Memoir, 82, 223-238. https://doi.org/10.1306/M82813C12
Eguiluz de Antuñano, S., Aranda-García, M., Marrett, R., 2000, Tectónica de la Sierra Madre Oriental: Boletín de la Sociedad Geológica Mexicana, 53(1), 1-26. https://doi.org/10.18268/bsgm2000v53n1a1
Ferrari, L., Orozco-Esquivel, T., Manea, B., Manea., M., 2012, The dynamic history of the Trans-Mexican Volcanic Belt and the Mexico subduction zone: Tectonophysisc, 522-523, 122-149. https://doi:10.1016/j.tecto.2011.09.018
Fitz-Díaz, E., Tolson, G., Camprubí, A., Rubio-Ramos, M.A., Prol-Ledesma, R.M., 2008, Deformación, vetas, inclusiones fluidas y la evolución tectónica de las rocas cretácicas de Valle de Bravo, Estado de México, México: Revista Mexicana de Ciencias Geológicas, 25, 59-81.
Fitz-Díaz, E., Tolson, G., Hudleston, P., Bolaños-Rodríguez, D., Ortega-Flores, B., Vásquez- Serrano, A., 2012, The role of folding in the development of the Mexican fold-and-thrust belt: Geosphere, 8, 931-949. https://doi.org/10.1130/GES00759.1
Fitz-Díaz, E., Hudleston, P., Tolson, G., van der Pluijm, B., 2014, Progressive, episodic deformation in the Mexican Fold-Thrust Belt (central Mexico): Evidence from isotopic dating of folds and faults: International Geology Review, 56, 734–755. https://doi.org/10.1080/00206814.2014 .896228.
Fitz-Díaz, E., Lawton, T.F., Juárez-Arriaga, E., Chávez-Caballero, G., 2018, The Cretaceous-Paleogene Mexican orogen: Structure, basin development, magmatism and tectonics: Earth-Science Reviews, 183, 56-84. https://doi.org/10.1016/j.earscirev.2017.03.002
Gámez-Ordaz, V., Ávila-Ramos, F.J., 2017, Carta geológico-minera Buenavista, F14-C55, 1: 50,000: Pachuca, Hidalgo., Subsecretaría de Minería, Servicio Geológico Mexicano, 1 mapa con texto.
Garduño-Martínez, D.E., Pi Puig, T., Solé, J., Martini, M., Alcala-Martínez, J.R., 2015, K-Ar illite-mica age constraints on the formation and reactivation of the El Doctor fault zone, central Mexico: Revista Mexicana de Ciencias Geológicas, 32, 306–322.
Guerrero-Paz, D.N., Abdullin, F., Ortega-Flores, B., Solari, L., Ortega-Obregón, C., Juárez-Arriaga, E., 2020, Late Cretaceous to Eocene denudation history of the Tolimán area, southern Sierra Madre Oriental, central Mexico, in Martens, U., Molina Garza, R.S., (eds.), Southern and Central Mexico: Basement Framework, Tectonic Evolution, and Provenance of Mesozoic–Cenozoic Basins: Geological Society of America Special Paper 546, 1-13. https://doi.org/10.1130/2019.2546(18).
Hudleston, P.J., Treagus, S.H., 2010, Information from folds: A review: Journal of Structural Geology, 32, 2042-2071. https://doi.org/10.1016/j.jsg.2010.08.011
Juárez-Arriaga, E., Lawton, T.F., Ocampo-Díaz, Y.Z.E., Stockli, D.F., Solari, L., 2019a, Sediment provenance, sediment-dispersal systems, and major arc-magmatic events recorded in the Mexican foreland basin, north-central and northeastern Mexico: International Geology Review, 61, 2118-2142. https://doi.org/10.1080/00206814.2019.1581848
Juárez-Arriaga, E., Lawton, T.F., Stockli, D.F., Solari, L., Martens, U., 2019b, Late Cretaceous-Paleocene stratigraphic and structural evolution of the central Mexican fold and thrust belt, from detrital zircon (U-Th)/(He-Pb) ages: Journal of South American Earth Sciences, 95, 1-17. https://doi.org/10.1016/j.jsames.2019.102264
Kerdan, T.P., 1992, Estructura de la corteza y manto superior en el norte de México (a lo largo del Trópico de Cáncer desde Baja California hasta el Golfo de México), CDMX, México, Universidad Nacional Autónoma de México, Tesis de maestría, 347 p.
Ludwig, K.R., 2012, Isoplot/Ex 3.6: A Geochronologic Toolkit for Microsoft Excel: Berkeley Geochronology Center Special Publication, 4, 77 p.
Magaña-Castillo, L., 2018, Análisis del efecto de la geometría del límite cuenca-plataforma en la deformación de las rocas de la Cuenca de Zimapán a través de experimentos analógicos: CDMX, México, Instituto Politécnico Nacional, tesis de licenciatura, 129 p.
Martínez-Reyes, J., 1992, Mapa geológico de la Sierra de Guanajuato con resumen de la geología de la Sierra de Guanajuato: México, Universidad Nacional Autónoma de México, Instituto de Geología, Serie Cartas Geológicas y Mineras, 8, 1 mapa con texto.
Martini, M., Mori, L., Solari, L., Centeno-García, E., 2011, Sandstone provenance of the Arperos basin (Sierra de Guanajuato, central Mexico): late Jurassic-early cretaceous back-arc spreading as the foundation of the Guerrero terrane: The Journal of Geology, 119, 597-617. http://dx.doi.org/ 10.1086/661989
Martini, M., Solari, L., Camprubí, A., 2013, Kinematics of the Guerrero terrane accretion in the Sierra de Guanajuato, central Mexico: New insights for the structural evolution of arc-continent collisional zones: International Geology Review, 55, 574-589. http://dx.doi.org/ 10.1080/00206814.2012.729361
Martini, M., Solé, J., Garduño-Martínez, D.E., Pi Puig, T., Omaña, L., 2016, Evidence for two Cretaceous superposed orogenic belts in central Mexico based on paleontologic and K-Ar geochronologic data from the Sierra de los Cuarzos: Geosphere, 12, 1–14. http://dx.doi.org/ 10.1130/GES01275.1.
Nieto-Samaniego, Á.F., Ferrari, L., Alaniz-Álvarez, S.A., Labarthe-Hernández, G., Rosas-Elguera, J., 1999a, Variation of Cenozoic extension and volcanism across the southern Sierra Madre Occidental volcanic province, Mexico: Geological Society of America Bulletin, 111, 347-363. https://doi.org/10.1130/0016-7606(1999)111%3C0347:VOCEAV%3E2.3.CO;2
Nieto-Samaniego, Á.F., Alaniz-Álvarez, S.A., Cerca-Martínez, M., 1999b, Carta geológico-minera San Miguel de Allende F14-C54, 1: 50,000: Pachuca, Hidalgo., Secretaría de Economía, Servicio Geológico Mexicano, 1 mapa con texto
Nieto-Samaniego, Á.F., Alaniz-Álvarez, S.A., Camprubi i Cano, A., 2005, La Mesa Central de México: estratigrafía, estructura y evolución tectónica cenozoica: Boletín de la Sociedad Geológica Mexicana, 57, 285-318. http://dx.doi.org/10.18268/bsgm2005v57n3a3
Nieto-Samaniego, Á.F., Alaniz-Álvarez, S.A., Camprubí, A., 2007, Mesa Central of México: Stratigraphy, structure, and Cenozoic tectonic evolution, en Alaniz-Álvarez, S.A., y Nieto-Samaniego, A.F., (eds.), Geology of México: Celebrating the Centenary of the Geological Society of México: Geological Society of America Special Paper, 422, 41–70. https://doi.org/ 10.1130/2007.2422(02)
Núñez-Silva, D.E., 2020, Evolución de los sistemas de fallas entre San Miguel de Allende y San José Iturbide, Taxco el Viejo, Guerrero: México, Universidad Autónoma de Guerrero, Escuela Superior de Ciencias de la Tierra, Tesis de licenciatura, 117 p.
Ortega-Flores, B., Solari, L., Lawton, T.F., y Ortega-Obregón, C., 2014, Detrital-zircon record of major Middle Triassic–Early Cretaceous provenance shift, central Mexico: demise of Gondwanan continental fluvial systems and onset of back-arc volcanism and sedimentation: International Geology Review, 56, 237-261. https://doi.org/10.1080/00206814.2013.844313
Ortiz-Hernández, L.E., Acevedo-Sandoval, O.A., Flores-Castro, K., 2003, Early Cretaceous intraplate seamounts from Guanajuato, central Mexico: geochemical and mineralogical data: Revista Mexicana de Ciencias Geológicas, 20, 27-40.
Palacios-García, N.B., 2013, Análisis petro-tectónico de la sucesión mesozoica de la Sierra de los Cuarzos, centro de México: Reconocimiento de un depósito sintectónico relacionado con la acreción del terreno Guerrero: CDMX, México, Universidad Nacional Autónoma de México, Instituto de Geología, Tesis de maestría, 154 p.
Palacios-García, N.B., Martini, M., 2014, From back-arc rifting to arc accretion: the Late Jurassic–Early Cretaceous evolution of the Guerrero terrane recorded by a major provenance change in sandstones from the Sierra de los Cuarzos area, central Mexico: International Geology Review, 56, 1377-1394. http://dx.doi.org/10.1080/00206814.2014.938367
Paton, C., Woodhead, J.D., Hellstrom, J.C., Hergt, J.M., Greig, A., Maas, R., 2010, Improved laser ablation U-Pb zircon geochronology through robust downhole fractionation correction: Geochemistry Geophysics Geosystems, 11, 1-36. https://doi.org/10.1029/2009GC002618
Pérez-Venzor, J.A., Aranda-Gómez, J.J., McDowell, F., Solorio- Munguía, J.G., 1996, Geología del volcán Palo Huérfano, Guanajuato, México: Revista Mexicana de Ciencias Geológicas, 13, 174-183.
Petrus, J.A., Kamber, B.S., 2012, VizualAge: a novel approach to laser ablation ICP–MS U–Pb geochronology data reduction: Geostandars and Geoanalytical Research, 36, 247–270. http://dx.doi.org/10.1111/j.1751-908X.2012.00158.x
Quintero-Legorreta, O., 1992, Geología de la región de Comanja, Estados de Guanajuato y Jalisco: Revista Mexicana de Ciencias Geológicas, 10(1), 6–25.
Reyes-Reyes, N.A., Luna-Castro-H., 1998, Carta geológico-minera Mineral de Pozos F14-C45, 1: 50,000: Pachuca, Hidalgo., Secretaría de Economía, Servicio Geológico Mexicano, 1 mapa con texto explicativo.
Rivera, J., Ponce, L., 1986, Estructura de la corteza al oriente de la Sierra Madre Occidental, México, basada en la velocidad del grupo de las ondas Rayleigh: Geofísica Internacional, 25(3), 383-402. https://doi.org/10.22201/igeof.00167169p.1986.25.3.1223
Salinas-Prieto, J.C., Monod, O., Faure, M., 2000, Ductile deformations of opposite vergence in the eastern part of the Guerrero Terrane (SW Mexico): Journal of South American Earth Sciences, Special Issue, Geologic evolution of the Guerrero Terrane, western Mexico, 13, 389-402. https://doi.org/10.1016/S0895-9811(00)00031-6
Scripps Institution of Oceanography, 1994, ASCII file of Gravity Anomaly or Topography, University of California San Diego, actualizado 29 de abril 2019, disponible en: <https://topex.ucsd.edu/marine_grav/mar_grav.html >, consultado 29 de noviembre 2018.
Sedlock, R. L., Ortega-Gutiérrez, F., Speed, R. C., 1993, Tectonostratigraphic terranes and tectonic evolution of Mexico: USA, Geological Society of America Special Paper, 278, 153p.
Solari, L.A., Gómez-Tuena, A., Bernal, J.P., Pérez-Arvizu, O., Tanner, M., 2010, U-Pb Zircon Geochronology with an Integrated LA-ICP-MS Microanalytical Workstation: Achievements in Precision and Accuracy: Geostandards and Geoanalytical Research, 34, 5-18. http://dx.doi.org/10.1111/j.1751-908X.2009.00027.x
Solari, L.A., González-León, C.M., Ortega-Obregón, C., Valencia-Moreno, M., Rascón-Heimpel, M.A., 2018, The Proterozoic of NW Mexico revisited: U–Pb geochronology and Hf isotopes of Sonoran rocks and their tectonic implications: International Journal of Earth Sciences, 107, 845-861. https://doi:10.1007/s00531-017-1517-2
Spector, A., Grant, S., 1970, Statistical models for interpreting aeromagnetic data: Geophysics, 35 (2), 293-302. https://doi.org/10.1190/1.1440092
Tardy, M., Lapierre, H., Freydier, C., Coulon, C., Gill, J.B., Mercier De Lepinay, B., Beck, C., Martinez, J., Talavera- Mendoza, O., Ortiz, E., Stein, G., Bourdier, J.L., and Yta, M., 1994, The Guerrero suspect terrane (western Mexico) and coeval arc terranes (the Greater Antilles and the Western Cordillera of Colombia): A late Mesozoic intra-oceanic arc accreted to cratonal America during the Cretaceous: Tectonophysics, 230, 49-73. https://doi.org/10.1016/0040-1951(94)90146-5
Tristán-González, M., Aguirre-Díaz, G.J., Labarthe-Hernández, G., Torres-Hernández, J.R., Bellon, H., 2009, Post-Laramide and pre-Basin and Range deformation and implications for Paleogene (55–25 Ma) volcanism in central Mexico: A geological basis for a volcano-tectonic, stress model: Tectonophysics, 471, 136-152. https://doi.org/10.1016/j.tecto.2008.12.021
Vásquez-Serrano, A., Tolson, G., Fitz Díaz, E., Chávez Cabello, G., 2018, Influence of pre-tectonic carbonate facies architecture on deformation patterns of syntectonic turbidites, an example from the central Mexican fold-thrust belt: Journal of Structural Geology, 109, 127-139. https://doi:10.1016/j.jsg.2018.02.004
Vásquez-Serrano, A., Nieto-Samaniego, Á.F., Alaniz-Álvarez, S.A., Rangel-Granados, E., 2019, Shortening and kinematics of the Late Triassic rocks in the Tolimán area, central Mexico: Journal of South American Earth Sciences, 95, 1-11. https://doi.org/10.1016/j.jsames.2019.102303
Viola, G., Mancktelow, N.S., 2005, From XY tracking to buckling; axial plane cleavage fanning and folding during progressive deformation: Journal of Structural Geology, 27, 409-417. https://doi.org/10.1016/j.jsg.2004.10.011
Wilson, J.R., Ward, W.C., 1993, Early Cretaceous carbonate platforms of northeastern and east-central Mexico, in Simon, J.A.T., Scott, R.W., Masse, J.P., (eds.), Cretaceous carbonate platforms: American Association of Petroleum Geologists Memoir, 56, 35-50.
Xu, S-S., Nieto-Samaniego, Á.F., Alaniz-Álvarez, S.A., Cerca-Martínez, L.M., 2011, Structural analysis of a relay ramp in the Querétaro graben, central Mexico: implications for relay ramp development: Revista Mexicana de Ciencias Geológicas, 28, 275-289.
Anexo
| Tabla 1. Edades de circón detrítico de la muestra LN-01. |
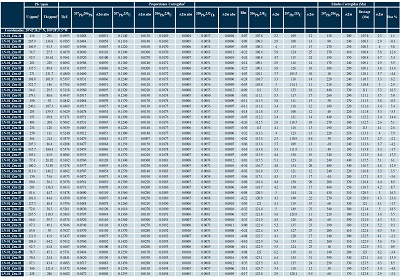 |
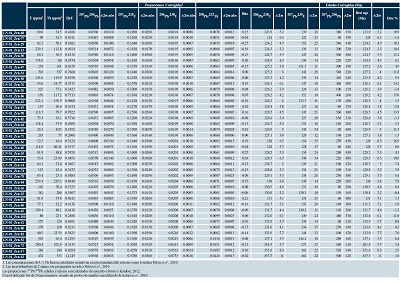 |
| Tabla 2. Edades de circón detrítico de la muestra SMA-01. |
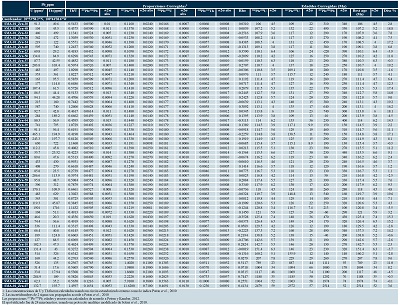 |
|
Boletín de la Sociedad Geológica Mexicana Volumen 73, núm. 2, A040121, 2021 |
 |
Geophysical characterization of a potentially active fault in the Agua Fría micro-graben, Los Azufres, Mexico
Caracterización geofísica de una falla potencialmente activa en el micrograben Agua Fría, Los Azufres, México
Jélime Cecilia Aray Castellano1,*, Pierre Lacan2, Víctor Hugo Garduño Monroy†, 3, Jesús Ávila García4, Joaquín Gómez Cortés3, Franck A. Audemard M.5, Octavio Lázaro Mancilla6, William Bandy7
1 Posgrado en Ciencias de la Tierra, Centro de Geociencias, Universidad Nacional Autónoma de México, Blvd. Juriquilla, 3001,76230, Querétaro, Mexico.
2 Centro de Geociencias, Universidad Nacional Autónoma de México, Blvd. Juriquilla, 3001, 76230, Juriquilla, Querétaro, Mexico.
3 Instituto de Investigaciones en Ciencias de la Tierra, Universidad Michoacana de San Nicolás de Hidalgo, Ciudad Universitaria, 58060, Morelia, Michoacán, Mexico.
4 Posgrado en Ciencias de la Tierra, Instituto de Geofísica, Universidad Nacional Autónoma de México, Circuito de la Investigación Científica, Ciudad Universitaria, Ciudad de México, 04510, Mexico.
5 Departamento de Geología, Universidad Central de Venezuela, Ciudad Universitaria, Los Chaguaramos, 1050, Caracas, Venezuela.
6 Laboratorio de Sismología y Geofísica Aplicada, Instituto de Ingeniería, Universidad Autónoma de Baja California. Blvd. Benito Juárez y Calle de la Normal S/N, Mexicali, B. C., 21280, Mexico.
7 Instituto de Geofísica, Universidad Nacional Autónoma de México, Circuito de la Investigación Científica, Ciudad Universitaria, Ciudad de México, 04510, Mexico.
* Corresponding author: (J.C. Aray Castellano)
This email address is being protected from spambots. You need JavaScript enabled to view it.
How to cite this article:
Aray Castellano, J.C., Lacan, P., Garduño Monroy, V.H., Ávila García, J., Gómez Cortés, J., Audemard M., F. A., Lázaro Mancilla, O., Bandy, W., 2021, Geophysical characterization of a potentially active fault in the Agua Fría micro-graben, Los Azufres, Mexico: Boletín de la Sociedad Geológica Mexicana, 73 (2), A040121. http://dx.doi.org/10.18268/BSGM2021v73n2a040121
ABSTRACT
In this study, three geophysical techniques were used to identify, localize, and characterize a partly blind fault in the Llano Grande basin within the Agua Fría Graben. This tectonic basin is located in the Los Azufres Volcanic Complex, one of the major silicic volcanic centers in the Trans-Mexican Volcanic Belt. The 1 km wide Agua Fría graben could be considered as an analogous of the larger graben structures bounded by the Morelia-Acambay Fault System. Since it is filled by recent sediments, it represents a challenge for the recognition and characterization of active faults that lack clear surface expression. Newly collected magnetic data led to the identification of lineaments interpreted as structural discontinuities. Ground penetrating radar and seismic refraction surveys were carried out across one of these magnetic lineaments crossing the basin to characterize the nature and geometry of the inferred discontinuity. The ground penetrating radar profiles allowed the identification of buried deformational structures interpreted as the northern segment of the Agua Fría fault. The subsurface reflectors displaced 1 to 1.5 m by the fault indicate that this structure is potentially active. The opening of trenches based on these results makes it possible to confirm the interpretation of the geophysical profiles, to discuss the precision of the data and to validate their use for such studies. On seismic refraction profiles, the deformation zones are related to low P-wave velocity zones. These geophysical studies demonstrate the potential of such techniques to locate faults in the subsurface, partially characterize the width of the fault zone and the associated displacement within the uppermost of the subsurface. Our results may be applied to define ideal sites for paleoseismic excavations which are essential for the identification and description of historical and prehistoric earthquakes, and thus, for the characterization of the local seismic hazard.
Keywords: Ground penetrating radar, seismic refraction, magnetic methods, active fault, paleoseismology, Morelia-Acambay fault system.
RESUMEN
En este estudio se emplearon tres técnicas geofísicas para identificar, localizar y caracterizar una falla parcialmente ciega en la cuenca de Llano Grande dentro del graben de Agua Fría. Esta cuenca tectónica se encuentra en el complejo volcánico Los Azufres, uno de los principales centros silícicos del Cinturón Volcánico Transmexicano. El graben de Agua Fría de 1 km de ancho, podría considerarse como análogo a las estructuras de graben más grandes delimitadas por el sistema de fallas Morelia-Acambay. Dado que está lleno de sedimentos recientes, presenta un desafío en cuanto a la identificación y caracterización de fallas activas que carecen de clara expresión superficial. Los datos magnéticos obtenidos para este trabajo nos permitieron identificar lineamientos interpretados como discontinuidades estructurales. Levantamientos con georadar y refracción sísmica se realizaron sobre uno de estos lineamientos magnéticos que cruzan la cuenca, para caracterizar la naturaleza y geometría de la discontinuidad inferida. Los perfiles de georadar permitieron la identificación de estructuras de deformación las cuales son interpretadas como el segmento norte de la falla Agua Fría. Los reflectores desplazados entre 1 y 1.5 m por la falla, indican que esta estructura es potencialmente activa. La apertura de trincheras con base en estos resultados confirma la interpretación de perfiles geofísicos y permite validar su precisión y su uso para este tipo de estudios. En los perfiles de refracción sísmica, las zonas de deformación están relacionadas con zonas de baja velocidad de ondas P. Estos estudios geofísicos demuestran la potencialidad de estas técnicas para localizar fallas en subsuelo a poca profundidad, caracterizar parcialmente el ancho de su zona de influencia y el desplazamiento asociado en los primeros metros del subsuelo. Nuestros resultados podrían ser aplicados para definir sitios ideales para excavaciones paleosísmicas que son esenciales para la identificación y descripción de terremotos históricos o prehistóricos y, por lo tanto, para la caracterización del peligro sísmico local.
Palabras clave: Georadar, sísmica de refracción, método magnético, fallas activas, paleosismología, sistema de fallas Morelia-Acambay.
- Introduction
The characterization of capable crustal faults for the evaluation of the seismic hazard implies knowledge of their cartographic length, their geometry and location. Thus, precise knowledge of these parameters is necessary for a reliable estimation of expected earthquakes and, consequently, a more reliable hazard analysis (e.g. Audemard and Singer, 1996; Audemard et al., 2000; Oldecop and Perucca, 2012). These parameters are usually evaluated using standard structural geology and geomorphology tools.
However, in some cases, all or part of the faults may be invisible on the surface due, for example, to high sedimentation or erosion rates (e.g. Nguyen et al., 2007; Pueyo Anchuela et al., 2016; Lacan and Arango-Galván, 2021).Such difficulties in identifying and characterizing the geometry of partly buried active faults are particularly true in the Trans Mexican Volcanic Belt (TMVB), an E-W volcanic arc that crosses central Mexico from the Pacific Ocean to the Gulf of Mexico (Figure 1A). Most of the TMVB is affected by intra-arc extension and is, therefore, cut by several normal fault systems. In the central part of the TMVB, the Morelia-Acambay fault system (MAFS) consists of close to a hundred active E-W to ENE-WSW normal faults, distributed over 200 km between the cities of Morelia and Acambay (Figure 1A; Suter et al., 1992, 1995, 2001; Garduño-Monroy et al., 2009; Mendoza-Ponce et al., 2018; Ortuño et al., 2019).
Historical and instrumental earthquake records provide evidence of activity of at least some faults of the MAFS (Suárez et al., 2019, 2020). The most emblematic historical earthquakes in this area are the 1912 Acambay (Ms 6.9; Urbina and Camacho, 1913; Suter et al., 1995; Langridge et al., 2000), the 1979 Maravatio earthquake (Mw 5.5; Astiz-Delgado, 1980; Rodríguez-Pérez and Zúñiga, 2017) and probably the 1858 St. Juliana earthquake (Figueroa, 1987; Suárez et al., 2019, 2020). Paleoseismological studies confirmed the Holocene activity of most of the faults of this system, obtaining recurrence intervals for large (M≥6) earthquakes of between 1,000 and 10,000 years along any given fault (Langridge et al., 2000, 2013; Sunye-Puchol et al., 2015; Ortuño et al., 2015, 2019; Suter, 2016; Lacan et al., 2018; Soria-Caballero et al., 2019). East of the MAFS, there is no geomorphic evidence of active faulting (Figure 1A). Nevertheless, the occurrence of the destructive 1920 Jalapa earthquake (Mw 6.4, Suárez, 1992; Suárez and Novelo-Casanova, 2018), as well as additional seismic events which took place in the eastern TMVB (Suter et al., 1996), represents clear indications that the region is tectonically active and the related seismic hazard has to be evaluated (Zúñiga et al., 2020).
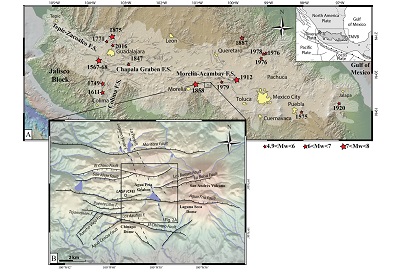 |
| Figure 1. (A) Seismotectonic and historical seismicity map of the Trans-Mexican Volcanic Belt (TMVB). Modified from Ferrari et al. (2012); Suárez et al. (2019); Suter (2019); Zúñiga et al. (2020). (B) Structural map of the Los Azufres Volcanic Field. LAGF= Los Azufres Geothermal Field (CFE Power plant). |
The MAFS defines a succession of grabens and half grabens partially filled with Pleistocene to Holocene sediments (e.g. Martínez-Reyes and Nieto-Samaniego, 1990). In the central part of the MAFS, the Los Azufres volcanic field is crossed by different faults which form the small Agua Fría graben (Dobson and Mahood, 1985; Ferrari et al., 1991; Pradal and Robin, 1994) within which the Los Azufres geothermal power plant is located (LAGF; Figure 1B). This 1 km wide graben represents a good analogous of the larger-scale structures that form the MAFS. In this area, several tectonic structures have been identified based on structural geology and geomorphic studies (e.g. Camacho, 1976; De La Cruz et al., 1983; Ferrari et al., 1991; Pérez-Esquivias et al., 2010). For the past three years, our group has been focusing on the neotectonic study of the Agua Fría fault, the longest of the tectonic structures identified in the Los Azufres volcanic Field, and the evaluation of the related seismic hazard. To do so, detailed structural and geomorphological mapping was carried out along this fault and the northern segment of the Agua Fría fault was identified (Campos Medina, 2018). To specify its location and estimate its extension in the sedimentary filling of the Agua Fría Graben, where the fault does not present any topographical expression, geophysical subsurface prospecting was necessary.
In this context, the main purpose of this work is to identify, locate, and characterize the geometry of the partially blind and potentially active northern segment of the Agua Fría fault. To reach this main goal, a combination of non-invasive geophysical tools such as total magnetic field, ground penetrating radar (GPR), and seismic refraction are used to image a potentially active structure in the Llano Grande Basin (Figure 1B). Preliminary results have been used to identify paleoseismic excavation sites studied by Campos Medina (2018). These new paleoseismic results are used in the discussion of the present study to validate the interpretations of geophysical results.
In detail, the total magnetic field anomaly data are used to detect and map the main structural domains and the potential structural lineaments that separate them. Detailed high-resolution GPR profiles across one of these magnetic lineaments lead to image reflectors offsets and interpret the lineament as a capable fault and locate trenching sites. Furthermore, the seismic refraction allows for the determination of lateral and vertical velocity variations associated with the magnetically identified tectonic structure, and also to image the fault zone at depth.
- Geological framework
The TMVB is a Late Miocene to Holocene volcanic arc, which crosses Mexico from west to east (Ferrari, 2000 and references inside). It is intersected by several fault systems that have been partially reactivated at different times during its evolution (Ferrari et al., 2012 and references inside). The intra-arc Neogene deformation in the TMVB consists of extensional fault systems delimiting rift valleys, filled by volcanic materials and fluvio-lacustrine sediments (Johnson and Harrison, 1990; Ferrari et al., 2012). In the central part of the TMVB, the E-W active MAFS intersects NNE-SSW to NNW-SSE-trending Basin-and-Range extensional structures (Pasquarè et al., 1988; Ferrari et al., 1991).
The persistent activity of the MAFS has been demonstrated by the occurrence of historical earthquakes (Suárez et al., 2019), structural data (Suter et al., 2001), and paleoseismological studies that additionally characterize their seismogenic potential (Lacan et al., 2018 and references inside). Unfortunately, only few geophysical studies have been conducted to evaluate the geometry of the faults at depth and their relationships (e.g. Arzate et al., 2018).
Los Azufres Volcanic Complex (LAVC) in the State of Michoacán is located along and dissected by the MAFS. The E-W faults of the MAFS affect the topography of the volcanic edifice (Arce et al., 2012). Their mapping was set out at different scales for the needs of geothermal studies (Camacho, 1976; Dobson and Mahood, 1985; Ferrari et al., 1991; Pradal and Robin, 1994; Suter et al., 2001). However, their precise mapping and characterization for seismic hazard assessment started with our group three years ago (Campos Medina, 2018).The LAVC covers 676 km2. Its chemical composition is predominantly rhyolitic to dacitic, although some basaltic and andesitic products have been described (e.g. Ferrari et al., 1991; Macías et al., 2008; Figure 2A).
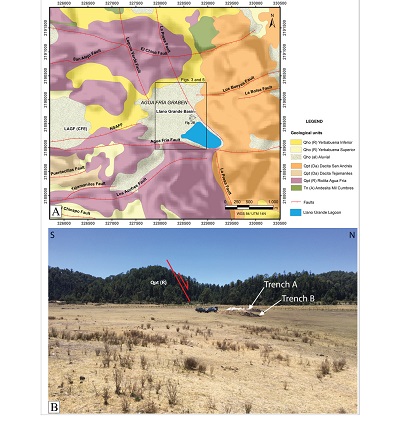 |
| Figure 2. (A) Geological map of the Agua Fría Graben showing the main geological units and fault traces. (B) Picture illustrating the morphological expression of the NSAFF on the rhyolitic basement and in the Llano Grande basin. The location of Campos Medina (2018) trenches A and B is shown. The black box indicates the magnetic studies area. LAGF= Los Azufres Geothermal Field (CFE Power plant), NSAFF= Northern segment of the Agua Fría Fault (modified from De La Cruz et al., 1983 and Campos Medina, 2018). |
The study area is a sedimentary basin called Llano Grande. It is located within the LAVC. This zone lies between 100° and 101° W, in the vicinity of LAGF which is 2850 masl. This area is approximately 100 km east of Morelia, within the small Agua Fría graben (Figures 1 and 2). The Agua Fría Graben is bounded by two faults of the MAFS: the Agua Fría fault (to the south) and the El Chino fault (to the north) and define the sedimentary basin of Llano Grande (Figure 2A). Locally, these active faults intersect with the older NNW-SSE Laguna Verde and N-S La Presa faults. These latter have been identified by structural geology and geophysical studies, but show little or no morphological expression (De La Cruz et al., 1983; Dobson and Mahood, 1985; Campos-Enríquez and Garduño-Monroy, 1995; Pérez-Esquivias et al., 2010). The bottom of the Llano Grande basin is partially covered by a dam lake to the south-east. The emerging part of the sedimentary filling (in the northwest) presents a relatively flat surface, chiseled by numerous topographic escarpments, mainly caused by the erosion of torrential streams. In this context, possible micro-topographic signals related to recent faulting are masked by the roughness of the ground (Figure 2B).
- Methodology
3.1. TOTAL FIELD MAGNETIC DATA
Non-invasive magnetics methods are often appropriate for locating blind structures (e.g. Glen et al., 2008). During the last five decades, a variety of methods based on vertical and horizontal gradients of magnetic potential-field anomalies have been developed and implemented for the determination of geologic boundaries, such as lithological contacts and faults, hence these methods are also valuable for the exploration of geothermal resources (Nabighian, 1972, 1974; Keating and Pilkington, 1990; Ferreira et al., 2013; Mazzoldi et al., 2020). At the studied site, a regular mesh was designed to acquire total field magnetic data using a Geometrics G-857 proton-precession magnetometer, connected with 2 m of horizontal resolution Garmin Oregon 450 GPS. Thirteen 1320 m-long N-S oriented profiles (in-lines) and five 1150 m-long orthogonal profiles (cross-lines) were surveyed. The spacing between stations was 25 m on each line (Figure 3), for a total of 583 field magnetic measurements.
The total field magnetic data have been corrected for diurnal variations using values of the Magnetic Observatory of Teoloyucan. The regional component of the Earth’s Magnetic Field (IGRF) has been removed to obtain the local anomaly.
To generate the final residual magnetic field map (RMF map) we have applied an Upward Continuation (UC) filter, which is essentially low pass in the frequency domain, to filter out the contributions of shallow sources (e.g. Gianiyu et al., 2013; Ferreira et al., 2013). Subsequently, a Reduced-to-Pole (RTP) map has been calculated by applying an RTP filter to the RMF data using a site magnetic Inclination and Declination of 47.27° and 5.22°, respectively. The RTP filter is used to deskew the anomaly, obtaining an anomaly that would have been observed if the Earth’s magnetic pole had been located at the measurement site. The processing methodology from Mazzoldi et al. (2020) has been used to obtain the magnetic anomaly. A spectral analysis was carried out on the RMF data to estimate the depths of the source bodies.
For this analysis, the magnetic data were transformed from the spatial domain to the frequency domain using the MAGMAP module of Geosoft’s Oasis Montaj software. Several authors (e.g. Garcia and Ness, 1994; Tatiana and Angelo, 1998, among others) explained the spectral analysis technique. It is based on the analysis of the magnetic data using Fourier Transform on the spectral analysis map and its computer conjugate (Araffa et al., 2017).
The horizontal derivative maps in both X and Y directions were generated from the RTP data.These maps emphasize the source effects, reducing the interference effects of the anomalies and yield an enhanced image of the boundaries (e.g. Skrame et al., 2016). For its part, the vertical derivative was mathematically determined from the total field magnetic anomaly map to highlight the locations of faults and contact features. The first vertical derivative represents a sharper resolution of near-surface features (Araffa et al., 2019).
3.2. THE 2D GPR SURVEY
Since the use of GPR is a classical technique to image buried structures, only a short overview of the GPR methodology is presented here. For a more complete description of the basics of GPR see Davis and Annan (1989), Neal (2004), among others. The technique is based on the measurements of the subsurface echoes of the transmitted high-frequency electromagnetic waves (EM; typically 16 MHz–1000 GHz). A transmitting antenna on the ground surface emits EM waves in distinct pulses that propagate into the ground and reflect or diffract at interfaces where the dielectric permittivity of the subsurface changes (Davis and Annan, 1989; Daniels, 2000; Jol and Bristow, 2003). EM wave velocity data allow the conversion of a time record of reflections to an estimated depth record (Gómez-Ortiz et al., 2007).
In paleoseismology, the use of GPR as a tool to detect and analyze the nature and architecture of active or Quaternary fault zones and faults in shallow subsurface is well known (e.g. Demanet et al., 2001; Rashed et al., 2003; Audemard et al., 2006; Christie et al., 2009; Pauselli et al., 2010; Wallace et al., 2010; Lacan et al., 2012; Cinti et al., 2015; Hermana et al., 2019; Gunda et al., 2020). The GPR profiles provide high-resolution images of shallow stratigraphy and subsurface fault zones which lack clear surface expressions. Hence, such profiles facilitate the identification, mapping, and characterization of the area affected by blind tectonic structures (Gunda et al., 2020).
The signal/noise ratio of GPR data is high when the permittivity contrast between the units displaced by the fault is significant because of the abrupt change in the electrical property of the material (Joshi et al., 2012). In the study area, the subsurface consists of intercalations of fluvio-lacustrine and volcanic units which could be represented by visible changes in the pattern of the reflectors. The 2D profiles were surveyed using a MALA GPR instrument equipped with 250 MHz and 100 MHz shielded antennas to achieve results with an ideal balance between penetration depth and vertical resolution. Profile lengths have been measured using an electro-mechanic odometer incorporated in the equipment. Topographic profiling was carried out with a GeoMax ZAL 132 instrument. We applied a basic processing sequence to the measured data, using the Reflex v.3 software (developed by Sandmeier, 2016), with common consistent steps such as drift removal (i.e. zero time correction), dewow filter, bandpass filter, background removal, topographic correction, depth control, etc. (e.g. Malik and Mohanty, 2007; Xavier and Gibson, 2011; Ercoli et al., 2013; Robinson et al., 2013). The average velocity of 0.11 m/ns was calculated using the velocity analysis tool in Reflex.
3.3. SEISMIC REFRACTION
The seismic refraction method is a useful tool to determine depths to subsurface interfaces and the velocities of the layer between them (Lillie, 1999). It illustrates P-wave or S-wave velocity variations of the subsurface and, in turn, this method allows for the interpretation of structural or stratigraphic discontinuities. Also, seismic refraction is commonly used in engineering, mining, groundwater, environmental or geothermal exploration (e.g. Shah et al., 2015; Brixová et al., 2018). Several investigations have also combined seismic refraction with other geophysical techniques (commonly Downhole geophysics, electrical and EM profiling) to recognize active fault zones and precisely locate trenching sites for seismic hazard assessment (e.g. Demanet et al., 2001; Terzic et al., 2017, 2019; Blecha et al., 2018).
The seismic refraction data at the Llano Grande basin have been acquired across the main anomalies identified with the magnetic study. The data were obtained using a GEOMETRICS, 24-channel, GEODE seismometer, with 4.5 Hz vertical geophones spaced 5 m apart. In most of the study, the controlled source used to generate acoustic waves was a 200 kg free-fall seismic source but in some less accessible sites, an 8 kg hammer was used. The source points were placed every 60 m on each 120 m long profile (at 0 m, 60 m, and 120 m). Each seismic section has a maximum recording time of 0.5 s and all seismic records were acquired with a sampling rate of 4,000 samples/s.
The arrivals of each seismic wave generated by the source are detected by the set of geophones. For each source point, a seismic section (from SEG-2 data format) was obtained using the Reflex v.3 software. The first arrivals of the seismic wave were picked for each geophone on the seismic section. For each profile, we integrated the arrival times interpreted on the seismic sections. We established a 2-3 layers initial model for each profile with their respective vertical velocity variations. Free software RAYINVR by Zelt and Smith (1992) was used to perform the forward modeling technique. This technique allows fitting the arrivals times calculated by the model to the first arrivals interpreted in each profile, therefore, a P-wave velocity model was obtained. Such a model was used to identify the P-wave vertical and lateral velocity variations which we relate with structural or lithological variations in the subsurface.
- Results
4.1. TOTAL FIELD MAGNETIC DATA
The RMF map (Figure 3A) and the RTP map (Figure 3B) show almost the same anomaly distribution with only a slight northward shift of the anomaly B. The magnitude of this anomaly increases both in its areal extent and its vertical relief. In the following, we will focus on describing the results obtained on the RTP map considering its precision in the direct interpretation of the magnetic sources.
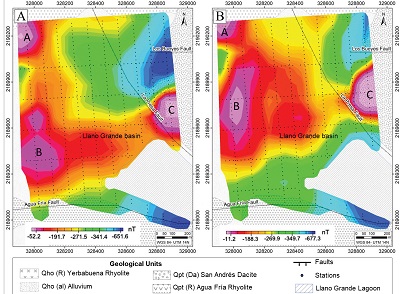 |
| Figure 3. Magnetic anomaly maps of the Llano Grande basin, (A) Residual magnetic field map (RMF map), (B) Reduction to the pole map (RTP map). A, B and C letters inside maps correspond to identified magnetic anomalies. |
The analysis of the RTP magnetic anomaly (Figure 3B) indicates that the magnetic field in the area has a maximum amplitude of about -11 nT to the northwest and the east of the studied area (A, B, and C in Figure 3B) and minimum amplitude of about -670 nT to the south and the northeast. The most important magnetic trends show two main orientations. One, in an ENE-WSW direction, in the central part of the study area, is more or less parallel to the Agua Fría fault and a second, in a NW-SE direction, is parallel to the Laguna Verde fault.
The radially averaged power spectrum (Figure 4) illustrates the estimated average depth levels of magnetic sources prevailing in the study area. This averaged power spectrum indicates that the deeper source is about 150 m and the shallower is about 62 m depth.
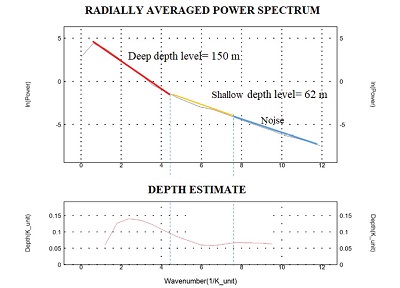 |
| Figure 4. 2-D radially averaged power spectrum for the magnetic data. |
The horizontal derivative maps in both X and Y directions are shown in Figure 5A and 5B). The map of the first horizontal derivative in the X-direction (Figure 5A) reveals that the trends dominating the Llano Grande area are oriented NNW-SSE and NNE–SSW. On the other hand, the map of the first horizontal derivative in the Y-direction (Figure 5B) shows that the most dominant trends are ENE -WSW. The vertical derivative map (Figure 5C) highlighted the edges of the magnetized structures and it reduced the complexity of anomalies observed in the horizontal derivative maps. The main magnetic lineaments in this map trend N-S and NE–SW.
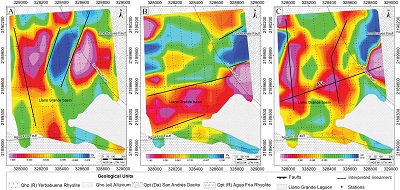 |
| Figure 5. Main interpreted lineaments over the processed magnetic anomaly maps. (A) First horizontal derivative of RTP map in X-direction, (B) first horizontal derivative of RTP map in Y-direction, (C) first vertical derivative of RTP map in Z-direction (FZD). AFL= Agua Fría Lineament. |
In this study, we have selected the central magnetic lineament of the basin which we call Agua Fría Lineament (AFL; Figure 5C), to be analyzed by the 2-D profiles. We use this nomenclature based on the fact that this magnetic lineament which extends from the west to the east side of the maps (Figures 5B and 5C), could be the blind extension of the northern segment of the Agua Fría fault mapped from its topographic escarpment between the CFE power plant (LAGF) and the Llano Grande basin (Figure 2A). This fault is suspected to be active by considering its morphology and orientation so its neotectonic study is challenging for the evaluation of seismic hazard.
4.2. THE 2D GPR SURVEY
Two sub-parallel GPR profiles have been surveyed across the ENE-WSW main magnetic lineament previously identified (Figure 6). By considering an average velocity of electromagnetic waves of 0.1 m/ns to unconsolidated alluvial materials (Annan, 2001; Jol and Bristow, 2003), the penetration depth is about 5 m on average for the 100 MHz antennas.
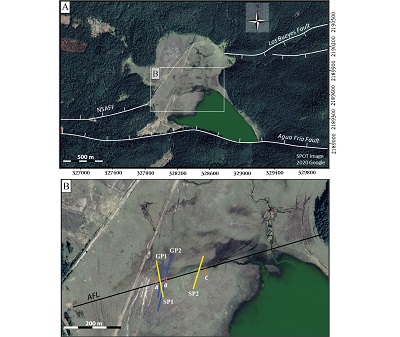 |
| Figure 6. Aerial photographs of the Llano Grande basin showing (A) the location of known crustal faults (NSAFF= Northern Segment of Agua Fría Fault) and, (B) the location of the Agua Fría Lineament (solid black line), the GPR and seismic profiles and Campos Medina (2018) trenches. Yellow lines= Seismic profiles, blue lines= GPR profiles, orange boxes= trenches (labeled A, B, C). |
In the profile GP1, three zones can be identified based on the reflection pattern in the processed and un-interpreted radargram (Figure 7A). The upper zone, located between 0 and 20 ns (Z1; Figure 7B), is characterized by high reflectivity, sub-horizontal signals of about 0.5 m thick. These layers lie over a high-attenuation intermediate unit (about 1 m thick), characterized by a chaotic reflectivity pattern and by gentle NE-dipping layers (Z2; Figure 7B). At the bottom, the third zone is characterized by hyperbolic diffractions describing a group of NE-dipping reflectors (Z3; Figure 7B).Between 40-60 m along the profile GP1, a series of reflector discontinuities are indicated with red continuous and segmented lines that cross sub-vertically all the reflector sequences in the record GP1 (Figure 7B). The discontinuities describe a 1 m vertical offset of the sequences.
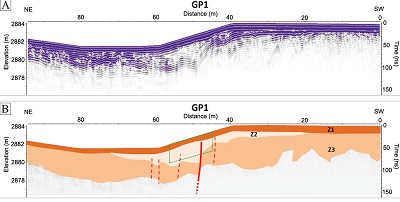 |
| Figure 7. GPR profile GP1 acquired using 100 MHz antennas across the Agua Fría Lineament. (A) Processed and un-interpreted profile, (B) processed and interpreted profile. Green dotted lines box shows the lateral projection of the 3A trench of Campos Medina (2018) on the GPR profile. The different colors represent changes in the electromagnetic response. Z1, Z2 and Z3 refer to the three zones described in the text.(Vertical Exaggeration= ~2.4x). |
Similar to that described for GP1, the high resolution obtained for the profile GP2 allows defining three main zones based on reflection pattern in the processed and un-interpreted profile (Figure 8A). The first two upper zones are very similar to those described in profile GP1 (Z1; Figure 8B).
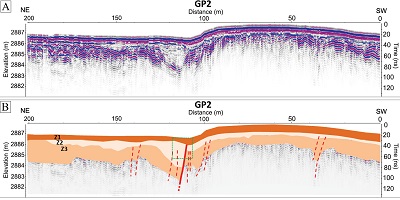 |
| Figure 8. GPR profile GP2 acquired using 100 MHz antennas across the Agua Fría Lineamentt. (A) Processed and un-interpreted profile, (B) processed and interpreted profile. Green dotted lines box shows the lateral projection of the 3B trench of Campos Medina (2018) on the GPR profile. The different colors represent changes in the electromagnetic response. Z1, Z2, Z3 refer to the three zones described in the text. (Vertical Exaggeration= ~6x). |
On the other hand, in the third zone, a fold-type reflector sequence is observed in the record (Z3; Figure 8B). This reflection pattern is different from those flat-type reflector sequences observed in the third zone of the profile GP1 (Z3; Figure 7B). In the record GP2, red continuous and segmented lines indicate the reflector discontinuities that cross sub-vertically all the reflector sequences (Figure 8B). At about 110 m along the profile, distorted radar reflectors exhibit an almost 1.5 m vertical offset.
4.3. SEISMIC REFRACTION
Two 120 m long seismic refraction profiles, SP1 and SP2, were surveyed on the AFL, approximately parallel to the GPR profiles (Figure 6). Profile SP1 has a NW-SE orientation, perpendicular to the magnetic lineament. SP1 ray-tracing model are shown in Figure 9A. The first arrivals, picked from seismic sections fitting the calculated travel times from forward modeling is shown in Figure 9B. Profile SP1 shows a gradual vertical increase in the P-wave velocity from approximately 130 m/s at the top to 340m/s at the bottom (Figure 9C).
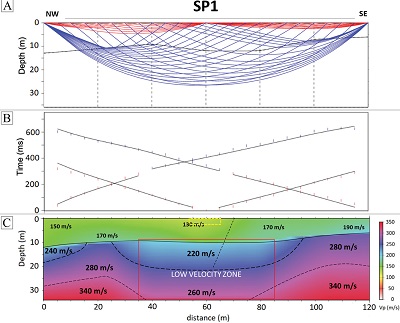 |
|
Figure 9. Seismic velocity model obtained for the profile SP1. (A) Ray-tracing model, (B) time arrivals from seismic section (vertical colored dashes) and calculated times from forward modeling (solid black lines), (C) Interpolated color-scaled velocity model. Dotted lines show abrupt lateral velocity change and the low-velocity area in the center of the profile is highlighted with a red rectangle. Yellow dotted lines box= lateral projection of the 3A trench of Campos Medina (2018) on the seismic profile. (No vertical exaggeration). |
Abrupt P-wave variations between 40-60 m/s are indicated with black segmented lines. A low-velocity zone is visible between 35 and 85 m along the profile which extends to depths of up to 35 m (red box; Figure 9C). Profile SP2 has a NE-SW orientation and has also been surveyed crossing the AFL (Figures 6). SP2 ray-tracing model is shown in Figure 10A. The first arrivals, picked from seismic sections fitting the calculated travel times from forward modeling are shown in Figure 10B. A gradual vertical increase in the P-wave velocity is visible from minimum velocities of 100 m/s (top NE side of the profile) to 290 m/s. The velocities obtained for this profile are lower than those observed in SP1. Velocity variations of at least 40 m/s are indicated with black segmented lines. Two abrupt lateral velocity variations (black segmented inclined lines) are observed at approximately 15 and 50 m along the profile in the upper sequences. In profile SP2, the lowest velocities are visible in the northeastern part of the profile. Lastly, a low-velocity zone that deepens below 10 m is indicated with a red box at a distance between 0 and 15 m along the profile (Figure 10C).
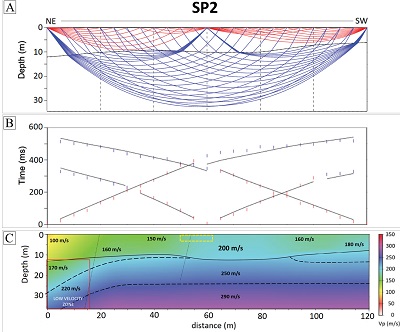 |
| Figure 10. Seismic velocity model obtained for the profile SP2. (A) Ray-tracing model, (B) Time arrivals from seismic section (vertical colored dashes) and calculated times from forward modeling (solid black lines), (C) Interpolated color-scaled velocity model. Dotted lines show abrupt lateral velocity change and the low-velocity area in the center of the profile is highlighted with a red rectangle. Yellow dotted lines box= lateral projection of the 3C trench of Campos Medina (2018) on the seismic profile. (No vertical exaggeration). |
- Discussion
For the evaluation of the seismic hazard, obtaining parameters such as the cartographic length of the faults, their geometry and the width of the fault zone is crucial. During the past decades, the faults bordering the Agua Fría graben have been described and mapped by structural analysis or photo interpretation (e.g. De la Cruz et al., 1983; Dobson and Mahood, 1985; Garduño-Monroy, 1987). However, the presence of faults within the micro-graben, less visible in morphology, was poorly constrained and therefore was not reported or was imprecisely mapped. In particular, the northern segment of the Agua Fría fault had never been mapped before our group identified it for the first time and determined with this study its possible continuity in the sedimentary filling of the Llano Grande basin that could neither be demonstrated nor discarded from classical geological observations.
The magnetic anomalies exhibit a high and low amplitude related to volcanic rocks (basement) and sediments, respectively. In general, the results of the interpretation of the magnetic anomaly maps correlate well with the known local geological contacts, faults, and structures (see Figures 2, 3, and 5). The anomaly A, identified in both the RMF and RTP maps (Figure 3), could be associated with the strongly magnetized volcanic rocks present in the La Yerbabuena Rhyolitic unit (Dobson and Mahood, 1985; Macías et al., 2008). In the same way, the anomaly C could correspond to the magnetic signature of the volcanic rocks forming the San Andrés dacitic dome (Dobson and Mahood, 1985). Combinations of directional derivatives of the magnetic data surveyed over the Llano Grande basin (Figure 5) allowed the identification of potentially important structures which cross the basement of the Llano Grande basin. Some solutions indicate the presence of lineaments that are possibly related to buried NE-SW and NNW-SSE faults. Although anomalies A and B are parallel to the NNW-SSE La Presa fault they would represent the southern prolongation of the Laguna Verde fault under the alluvial deposit. The alignment formed by anomalies B and C would correspond to the upthrown block of the Laguna Verde fault where structural highs of the Rhyolite may be buried. These structures are associated with the Basin and Range tectonic provinces and have been documented and referred to the eastern limit of the producing area of the geothermal field (e.g. De La Cruz et al., 1983; Dobson and Mahood, 1985; Garduño-Monroy et al., 1987; López-Hernández, 1991). Gradients with ENE-WSW and E-W orientation could correspond to faults accommodating the current N-S extension in the TMVB, similar to that reported by Campos-Enríquez and Garduño-Monroy (1995) in their regional study. We then focused our GPR and seismic refraction studies on the clearest WSW-ENE lineament called herein the AFL. This magnetic lineament crosses the entire study area and most likely corresponds to one of the potentially active faults intersecting the Los Azufres volcanic edifice (Figure 6).
Regarding the GPR data, the most apparent features in the two profiles are the diffraction hyperbolas and layer truncations. These are related with strong lateral contrast in permittivity across each material and are consistent with the presence of a fault or other geologic structures affecting the basement, as already previously highlighted in the literature (e.g. Busby and Merritt, 1999; Bano et al., 2002; Pauselli et al., 2010; Ercoli et al., 2013).
The two GPR profiles show reflector discontinuities which allow interpreting the AFL as a north-dipping normal fault displacing relatively shallow and therefore potentially recent sedimentary units (Figures 7 and 8). Inclined and distorted radar reflectors between 0.5 and 4 m depth indicate a deformation by 1 m to 1.5 m between the two blocks. Exploratory results of this study allowed the location of paleoseismic excavations reported preliminarily in the Master thesis of Campos Medina (2018). Three trenches were dug perpendicular to the fault and two of them are almost located on the axis of the radar profiles (location in Figure 6B; Campos Medina, 2018). The two trenches show an offset of the sedimentary units along a north-dipping fault which varies between 1.48 and 1.80 m in total. This deformation is distributed over a more or less wide fault zone. Trench A shows a very localized fault zone with a single north-dipping fault which accommodates all the displacement on one wall and a slightly more complicated fault zone on the other wall (two north-dipping synthetic faults and one south-dipping antithetic fault). For trench B, the fault zone is more complex and in the trench, only a fault propagation fold is visible accommodating the tectonic deformation over a 5 meters wide area. The fault zone is not visible in the trench which only exposes the first 2 m of the subsurface. The analysis of these trenches shows the reliability of the GPR for imaging such structures, both to locate them precisely in a landscape without clear morphological expression and to estimate the geometry, displacement and width of the fault zone which are of the same order of magnitude on the GPR profile and in the trenches.
The low-velocity zone identified in the seismic profile SP1 (Figure 9) corresponds geographically with the location of the fault previously highlighted by the GPR. In the profile SP2 (Figure 10), the abrupt lateral velocity variation at 50 m along the profile corresponds with the location of the AFL, while the lateral velocity variation at 15 m along the profile seems to correspond with the location of a gully identified by field observations. The low-velocity zone and the abrupt velocity variation in the seismic profiles are related to the variation of acoustic properties of materials, and it could correspond to altered rocks by fluid circulation along and in the vicinity of the fault plane as suggested by some authors (e.g. Pellerin and Christensen et al., 1998; Yan et al., 2005).
Figure 11 presents an overlay of the two GPR profiles (GP1 and GP2) with magnified views (up to 10 m depth) of the SP1 and SP2. This figure shows a strong correlation between both data sets and can be used to image and characterize the lineament highlighted in the magnetic maps and then to interpret it as a north-dipping normal fault displacing relatively shallow sedimentary units. The offset (vertical displacement) is about 20 ns in the radargrams. Using 0.1 m/ns velocity to time-depth conversion, give us an average vertical displacement of 1 to 1.5 m between reflectors with the same electromagnetic properties. Such displacement is compatible with the paleoseismic observations preliminary reported by Campos Medina (2018).
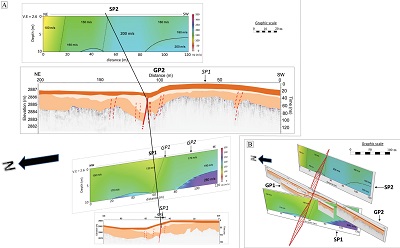 |
| Figure 11. Correlation of interpreted GPR records and magnified views up to 10 m depth of the seismic refraction profiles SP1 and SP2. (A) Plan view of interpreted GPR and seismic profiles at the same horizontal scale. The black line indicates the interpreted fault trace. (B) 3D view showing the relative distance between profiles according to the graphic scale. The red polygon indicates the estimated fault plane of the northern segment of the Agua Fría fault. |
Considering the location and the northward dip of the fault, we assume that this structure corresponds to the eastern prolongation of the northern segment of the Agua Fría fault (NSAFF) preserved in the morphology of the rhyolitic formations between LAGF and the Llano Grande basin as shown in Figure 12. Considering the surface sedimentation in the Llano Grande active basin, such deformation could be Holocene and according to the criteria proposed by Audemard (2003, 2005), this site was suitable and therefore the object of paleoseismological study which confirmed our preliminary interpretations (Campos Medina, 2018).
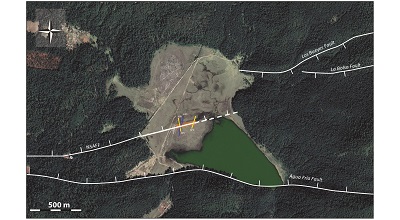 |
| Figure 12. Aerial photographs of the Llano Grande basin showing the eastern continuity of the northern segment of the Agua Fría fault identified through the integration of geophysical data. Orange box indicates the width of the fault zone. |
- Conclusions
Three complementary shallow geophysical techniques were used to image the structures affecting the basement of the Llano Grande basin in the Los Azufres volcanic field. The Total Field Magnetic data led us to identify anomalies and lineaments of different orientations. The GPR and seismic refraction techniques allowed us to structurally characterize the main magnetic lineament identified in the basin and to interpret it as a high angle north-dipping normal fault. The good resolution GPR data show inclined, distorted and displaced reflectors between 0.5 and 4 m depth allowing estimating the offset of the more superficial deposits in about 1-1.5 m. The GPR data, in this context, allow: 1) precisely locating the fault zone, 2) estimating the offset of the displaced sequences. In turn, the seismic refraction results indicate that the deformation extends in depth to more than 10 m and the horizontal width of the disrupted area associated with the fault is about 40 m but it increases with depth.
This fault is interpreted as the eastern prolongation of the northern segment of the Agua Fría fault hidden under the sedimentary cover of the Llano Grande basin. In this area, the GPR technique is the most effective to illuminate and characterize the fault zone. However, the other applied techniques were essentials to locate the main lineament in the basin and therefore to specify the interest area. The realization of paleoseismological trenches based on these results, allowed validating the precision in the geophysical localization of the fault as well as the accuracy of the interpretation of the GPR profiles.
Our results allow identifying, locating with precision, and characterizing a structure hardly visible on the surface and therefore unknown. This potentially active fault could have ruptured during the Holocene by considering the active sedimentation of the basin of Llano Grande. In such a context, this study is an essential step to carry out paleoseismological studies along the faults of the Los Azufres volcanic field.
At the scale of the fault systems affecting the central TMVB, the Agua Fría graben is an excellent analog of the 10 to 20 times larger tectonic basins formed by the faults forming the MAFS. The identification of potentially active structures under the Quaternary sedimentary filling of the Llano Grande basin allows improving both the cartographic precision and the estimation of the length of faults, as well as to constrain the relation between the different faults of the same system.
This work confirms the relevance of the use of such geophysical multidisciplinary techniques for the identification and characterization of buried structures before the excavation of paleoseismic trenches. Such studies would be relevant, for example, in most of the tectonic basins bordered by the faults from the MAFS. In fact, in most of these basins, there is no information available on the presence of blind faults and their extent. These structures lack surface expression but the potential tectonic activity is important to be considered for the evaluation of the seismic hazard.
Acknowledgements
This work was supported by the SENER-CONACYT grants (P17-CeMIEGeo project) and by the Universidad Nacional Autónoma de México (PAPIIT grant IA102317 and IN108220). We are thankful to INICIT-UMSNH for the use of their infrastructure and Laboratorio de Sismología y Geofísica Aplicada; and to Instituto de Ingeniería-UABC for the Reflex software license. The authors are grateful to the CFE (Comisión Federal de Electricidad) for allowing us to carry out the studies in the Llano Grande area. Sincere appreciation is extended to Isabel Israde-Alcántara, Oscar Campos-Enríquez, Dulce Gutiérrez, Magda Velázquez, Avith Mendoza, Diana Soria, Oscar García, Abigail Córdova, Adrián Jiménez, Luis Yegres and Juan Pablo Campos for their valuable support during field acquisitions, comments and contribution to this work. Dedicated to the Memory of Víctor Hugo Garduño Monroy who was the instigator of this study. This manuscript was greatly improved by comments and suggestions from Pedro Reyes and an anonymous reviewer.
References
Annan, A., 2001, Ground Penetrating Radar Workshop Notes: Sensors and Software, Inc., Mississauga, Ontario, Canada, 192 p.
Araffa, S. A. S, El-Bohoty, M., Heleika M., A., Mekkawi, M., Ismail, E., Khalil, A., Abd El-Razek, E. M., 2017, Implementation of magnetic and gravity methods to delineate the subsurface structural features of the basement complex in central Sinai area, Egypt: NRIAG Journal of Astronomy and Geophysics, 7, 162-174. https://doi.org/10.1016/j.nrjag.2017.12.002
Araffa, S. A. S Sabet, H. S., Mahmoud, M. H., 2019, Tectonics mapping using geophysical data around Nuweiba area, Gulf of Aqaba, Sinai, Egypt: NRIAG Journal of Astronomy and Geophysics, 8(1), 73-83. https://doi.org/10.1080/20909977.2019.1615802
Arce, J.L., Macías, J.L., Rangel, E., Layer, P., Garduño-Monroy, V.H., Saucedo, R., García, F., Castro, R., Pérez-Esquivias, H., 2012, Late Pleistocene rhyolitic explosive volcanism at Los Azufres Volcanic Field, central Mexico, in Aranda-Gómez, J.J., Tolson, G., Molina-Garza, R.S., (eds.), The Southern Cordillera and Beyond: Geological Society of America Field Guide, 25, 45-82. https://doi.org/10.1130/2012.0025(04)
Arzate, J., Lacan, P., Corbo-Camargo, F., Arango-Galván, C., Félix-Maldonado, R., Pacheco, J., León-Loya, R., 2018, Crustal structure of the Eastern Acambay Graben, Central Mexico, from integrated geophysical data: Revista Mexicana de Ciencias Geológicas, 35(3), 228-239. https://doi.org/10.22201/cgeo.20072902e.2018.3.864
Astiz-Delgado, L.M., 1980, Sismicidad en Acambay, Estado de México - el temblor del 22 de febrero de 1979: México, D.F., UNAM, Facultad de Ingeniería, Tesis de maestría, 130 p.
Audemard, F. A., 2003, Estudios paleosísmicos por trincheras en Venezuela: métodos, alcances, aplicaciones, limitaciones y perspectivas: Revista Geográfica Venezolana, 44(1), 11-46.
Audemard, F. A., 2005, Paleoseismology in Venezuela: objectives, methods, applications, limitations and perspectives: Tectonophysics, 408 (1-4), 29-61. https://doi.org/10.1016/j.tecto.2005.05.034
Audemard, F. A., Singer P., A., 1996, Active fault recognition in northwestern Venezuela and its seismogenic characterization: Neotectonic and paleoseismic approach: Geofísica Internacional, 35(3), 245-255.
Audemard, F. A., González, J., Rodríguez, J. A., Schmitz, M., Singer, A., 2000, Aportes de Funvisis a la evaluación de la amenaza sísmica en Venezuela y de sus potenciales efectos sobre la infraestructura (de la vivienda modesta a la instalación estratégica). In Lafuente M., Genatios, C, Castilla, E., Garcés, F., Marinilli, A., Anteliz, E. and Maggi, G. (eds.), Desastres sísmicos: escenarios, seguridad y prevención en ciudades de países en desarrollo. Centro de Ingeniería Sísmica –CESIS-IMME-UCV-. Caracas. AS-1 a AS-24.
Audemard, F. A., Ollarves, R., Díaz, G., Bechtold, M., Cataldi, A, 2006, El geo-radar como herramienta para la definición de fallas activas: aplicación en el sector central de la falla de Boconó, estado Mérida, Venezuela: Revista de la Facultad de Ingeniería de la U.C.V., 21(4), 57–70.
Bano, M., Edel, J. B., Herquel, G., EPGS class 2001-2002, E., 2002, Geophysical investigation of a recent shallow fault: The Leading Edge, 21(7), 648-650. https://doi.org/10.1190/1.1497317
Blecha V., Fischer, T., Tábořík, P., Vilhem, J., Klanica, R., Valenta, J., Štěpančíková, P., 2018, Geophysical evidence of the Eastern Marginal Fault of the Cheb Basin (Czech Republic): Studia Geophysica et Geodaetica, 62, 660–680. https://doi.org/10.1007/s11200-017-0452-9
Brixová, B., Mosná, A., Putiska, R., 2018, Applications of shallow seismic refraction measurements in the Western Carpathians (Slovakia): case studies: Contributions to Geophysics and Geodesy, 48(1), 1–21. https://doi.org/10.2478/congeo-2018-0001
Busby, J.P., Merritt, J.W., 1999, Quaternary deformation mapping with ground penetrating radar: Journal of Applied Geophysics, 41, 75–91. https://doi.org/10.1016/S0926-9851(98)00050-0
Camacho, P., 1976, Mapa preliminary del área geotérmica de Los Azufres, Michoacán, in Cathelineau, M., Oliver, R., Nieva, D., 1987, Geochemistry of volcanic series of the Los Azufres geothermal field (Mexico): Geofísica Internacional, 26-2, 273-290.
Campos Medina, J.P., 2018, Estudio paleosismológico del segmento norte de la falla Agua Fría, Los Azufres, Michoacán: México, Juriquilla, Centro de Geociencias, UNAM, Tesis de maestría, 88 p.
Campos-Enríquez, J.O., Garduño-Monroy, V. H., 1995, Los Azufres silicic center (Mexico): inference of caldera structural elements from gravity, aeromagnetic, and geoelectric data: Journal of Volcanology and Geothermal Research, 67, 123-152. https://doi.org/10.1016/0377-0273(94)00094-W
Christie, M., Tsoflias, G.P., Stockli, D.F., Black, R., 2009, Assessing fault displacement and off-fault deformation in an extensional tectonic setting using 3-D ground penetrating radar imaging: Journal of Applied Geophysics, 68, 9–16. https://doi.org/10.1016/j.jappgeo.2008.10.013
Cinti, F. R., Pauselli, C., Livio, F. , Ercoli, M., Brunori, C.A., Ferrario, M.F., Volpe, R., Civico, R., Pantosti, D., Pinzi, S., De Martini, P.M., Ventura, G., Alfonsi, L., Gambillara, R., Michetti, A.M., 2015, Integrating multidisciplinary, multiscale geological and geophysical data to image the Castrovillari fault (Northern Calabria, Italy): Geophysical Journal International, 203(3), 1847–1863. https://doi.org/10.1093/gji/ggv404
Daniels, J. J., 2000, Ground Penetrating Radar Fundamentals: Department of Geological Sciences, The Ohio State University, Appendix to a report to the U.S.E.P.A, Region V, 21 p.
Davis, J.L., Annan, A.P., 1989, Ground penetrating radar for high resolution mapping of soil and rock stratigraphy: Geophysical Prospecting, 37, 531–555. https://doi.org/10.1111/j.1365-2478.1989.tb02221.x
De La Cruz, V., Aguilar, J., Ortega, D., Sandoval, J. M., 1983, Estudio geológico-estructural a detalle del campo geotérmico Los Azufres, Mich.: Departamento de exploraciones, CFE, informe 9-82, 62 p.
Demanet, D., Renardly, F., Vanneste, K., Jongmans, D., Camelbeek, T., Meghraoui, M., 2001, The use of geophysical prospecting for imaging active faults in the Roer Graben, Belgium: Geophysics, 66, 78-89. https://doi.org/10.1190/1.1444925
Dobson, P.F., Mahood, G.A., 1985, Volcanic stratigraphy of the Los Azufres geothermal area, Mexico: Journal of Volcanology and Geothermal Research, 25 (3-4), 273-287. https://doi.org/10.1016/0377-0273(85)90017-4
Ercoli, M., Pauselli, C., Frigeri, A., Forte, E., Federico, C., 2013, Geophysical paleoseismology” through high resolution GPR data: a case of shallow faulting imaging in Central Italy: Journal of Applied Geophysics, 90, 27-40. https://doi.org/10.1016/j.jappgeo.2012.12.001
Ferrari, L., Garduño, V. H., Pasquarè, G., Tibaldi, A., 1991, Geology of Los Azufres Caldera, Mexico, and its relationships with regional tectonics: Journal of Volcanology and Geothermal Research, 47 (1-2), 129-148. https://doi.org/10.1016/0377-0273(91)90105-9
Ferrari, L., 2000, Avances en el conocimiento de la Faja Volcánica Transmexicana durante la última década: Boletín de la Sociedad Geológica Mexicana, 53, 84-92. https://doi.org/10.18268/BSGM2000v53n1a5
Ferrari, L., Orozco-Esquivel, T., Manea, V., Manea, M., 2012, The dynamic history of the Trans-Mexican Volcanic Belt and the Mexico subduction zone: Tectonophysics, 522,122–149. https://doi.org/10.1016/j.tecto.2011.09.018
Ferreira, F.J.F., Souza, J., Bongiolo, A.B.S., De Castro, L.G., 2013, Enhancement of the total horizontal gradient of magnetic anomalies using the tilt angle: Geophysics, 78, (3), J33-J41. https://doi.org/10.1190/geo2011-0441.1
Figueroa, J., 1987, Isosistas de Grandes Temblores Ocurridos en la República Mexicana: Instituto de Ingeniería, UNAM, Informe, 59 p.
Garcia, J. G., Ness, G. E., 1994, Inversion of the power spectrum from magnetic anomalies: Geophysics, 59(3), 391-400. https://doi.org/10.1190/1.1443601
Garduño-Monroy, V.H., 1987, Resumen de las conclusiones del modelo geológico regional del campo geotérmico de Los Azufres, Mich: Departamento de exploración, CFE, Reporte GG 9/879-82, 62 p.
Garduño-Monroy, V. H., Pérez, R., Israde, I., Rodríguez, M. A., Szynkaruk, E., Hernández, V. M., García, M. L., Corona, P., Ostroumov, M., Medina, V. H., García, G.; Carranza, O., Lopez, E., Mora, J. C., 2009, Paleoseismology of the southwestern Morelia-Acambay fault system, central Mexico: Geofísica Internacional, 48(3), 319-335.https://doi.org/10.22201/igeof.00167169p.2009.48.3.29
Gianiyu, S.A., Badmus, B.S., Awoyemi, M.O., Akinyemi, O.D. and Olurin O.T., 2013, Upward continuation and reduction to pole process on aeromagnetic data of Ibadan Area, South-Western Nigeria: Earth Science Research, 2(1), 66-73. https://doi.org/10.5539/esr.v2n1p66
Glen, J. M.G., Egger, A. E., Ponce, D. A., 2008, Structures Controlling Geothermal Circulation Identified Through Gravity and Magnetic Transects, Surprise Valley, California, Northwestern Great Basin: GRC Transactions, 32, 279-283.
Gómez-Ortiz, D., Martín-Velázquez, S., Martín-Crespo, T., Márquez, A., Lillo, J., López, I. Carreño, F., Martín-González, F., Herrera, R., De Pablo, M. A., 2007, Joint application of ground penetrating radar and electrical resistivity imaging to investigate volcanic materials and structures in Tenerife (Canary Islands, Spain): Journal of Applied Geophysics, 62, 287–300. https://doi.org/10.1016/j.jappgeo.2007.01.002
Gunda, G.K.T., Balaji, S., Champati Ray, P.K., Bhat, G. R., Balakrishna, Kannaujiya, S., 2020, Geophysical characterisation of the active fault geometry and trends in tectonic deformation in the shallow stratigraphy along active faults, South Andaman, India: Journal Geological Society of India, 95, 286–292. https://doi.org/10.1007/s12594-020-1427-y
Hermana, M., Genisa, M. Lubis, L., Sum CW., 2019, Identification of Active Faults in Landslide-Prone Regions Using Ground-Penetrating Radar: A Case Study from Bandung, Indonesia: Earth Crust, 4, 1-12. https://doi.org/10.5772/intechopen.85397
Johnson, C.A., Harrison, C.G.A., 1990, Neotectonics in central Mexico: Physics of the Earth and Planetary Interiors, 64 (2-4), 187-210. https://doi.org/10.1016/0031-9201(90)90037-X
Jol, H., Bristow, C., 2003, GPR in sediments: advice on data collection, basic processing and interpretation, a good practice guide: Geological Society London Special Publications, 211(1), 9-27. https://doi.org/10.1144/GSL.SP.2001.211.01.02
Joshi, P., Mautya, D. M., Chowksey, V., Chamyal, L. S., 2012, Shallow subsurface mapping of active faults using GPR in the seismically active Kachchh palaeo-rift basin, Western India: implication for neotectonic activity, in 14th International Conference on Ground Penetrating Radar (GPR), Shanghai, China, 844-849. https://doi.org/10.1109/ICGPR.2012.6254980
Keating, P.B., Pilkington, M., 1990, An automated method for the interpretation of magnetic vertical-gradient anomalies: Geophysics, 55 (3), 336-343. https://doi.org/10.1190/1.1442841
Lacan P., Nivière B., Rousset D., Sénéchal P., 2012, Late Pleistocene folding above the Mail Arrouy Thrust, North-Western Pyrenees (France): Tectonophysics, 541-543, 57-68. https://doi.org/10.1016/j.tecto.2012.03.022
Lacan, P., Ortuño, M., Audin, L., Perea, H., Baize, S., Aguirre-Díaz, G., Zúñiga, F.R., 2018, Sedimentary evidence of historical and prehistorical earthquakes along the venta de Bravo fault system, Acambay graben (Central Mexico): Sedimentary Geology, 365, 62–77. https://doi.org/10.1016/j.sedgeo.2017.12.008
Lacan, P., Arango-Galván, C., 2021, Geophysical evidences of the 1912 earthquake rupture along the central fault system of the Acambay Graben, Central Mexico: Boletín de la Sociedad Geológica Mexicana, 73(2),A250121. http://dx.doi.org/10.18268/BSGM2021v73n2a250121
Langridge, R.M., Weldon, II, R.J., Moya, J.C., Suárez, G., 2000, Paleoseismology of the 1912 Acambay earthquake and the Acambay-Tixmadejé fault, trans-Mexican volcanic belt: Journal of Geophysical Research Atmospheres, 105(B2), 3019-3037. https://doi.org/10.1029/199JB900239
Langridge, R.M., Persaud, M., Zúñiga, F.R., Aguirre-Díaz, G.J., Villamor, P., Lacan, P., 2013, Preliminary paleoseismic results from the Pastores fault and its role in the seismic hazard of the Acambay graben, Trans-Mexican Volcanic Belt, México: Revista Mexicana de Ciencias Geológicas, 30, 463–481.
Lillie, R. J., 1999, Whole Earth Geophysics. Prentice Hall. New Jersey, 361 p.
López-Hernández, A., 1991, Análisis estructural del campo geotérmico de Los Azufres, Mich. Interpretación de datos superficiales y de subsuelo: Oficina de Geología, CFE, Infome 11(91), 137 p.
Macías, J.L., Arce, J.L., Garduño, V.H., Castro, R., García-Tenorio, F., Saucedo, R., 2008, Estudio vulcanológico y estructural de la secuencia estratigráfica Mil Cumbres y la zona geotérmica de Los Azufres, Michoacán: Comisión Federal de Electricidad, reporte interno, 73 p.
Malik, J.N., Mohanty, C., 2007, Active tectonic influence on the evolution of drainage and landscape: geomorphic signatures from frontal and hinterland areas along Northwestern Himalaya, India: Journal of Asian Earth Sciences, 29(5–6), 604–618. https://doi.org/10.1016/j.jseaes.2006.03.010
Martínez-Reyes, J., Nieto-Samaniego, A.F., 1990, Efectos geológicos de la tectónica reciente en la parte central de México: Revista del Instituto de Geología de la Universidad Nacional Autónoma de México, 9, 33–50.
Mazzoldi, A., Garduño-Monroy, V. H., Gómez-Cortes, J. J., Guevara J. A., 2020, Geophysics for geothermal exploration. Directional-derivatives-based computational filters applied to geomagnetic data at lake Cuitzeo, México: Geofísica Internacional 59-2, 105-135. https://doi.org/10.13140/RG.2.2.15903.10403
Mendoza-Ponce, A., Figueroa-Soto, A., Soria-Caballero, D., Garduño-Monroy, V. H., 2018, Active faults sources for the Pátzcuaro–Acambay fault system (Mexico): fractal analysis of slip rates and magnitudes Mw estimated from fault length: Natural Hazards and Earth System Sciences, 18, 3121-3135. https://doi.org/10.5194/nhess-18-3121-2018
Nabighian, M.N., 1972, The analytic signal of two-dimensional magnetic bodies with polygonal cross-section: Its properties and use for automated anomaly interpretation: Geophysics, 37, 507-517. https://doi.org/10.1190/1.1440276
Nabighian, M.N., 1974, Additional comments on the analytic signal of two dimensional magnetic bodies with polygonal cross-section: Geophysics, 39, 85-92. https://doi.org/10.1190/1.1440416
Neal, A., 2004, Ground penetrating radar and its use in sedimentology: principles, problems, progress: Earth-Science Reviews, 66, 261–300. https://doi.org/10.1016/j.earscirev.2004.01.004
Nguyen, F., Garambois, S., Chardon, D., Hermitte, D., Bellier, O., Jongmans, D., 2007, Subsurface electrical imaging of anisotropic formations affected by a slow active reverse fault, Provence, France: Journal of Applied Geophysics, 62(4), 338-353. https://doi.org/10.1016/j.jappgeo.2007.03.003
Oldecop, L., Perucca, L., 2012, Aplicabilidad de métodos de evaluación de la amenaza sísmica para un proyecto minero (basada en datos neotectónicos, instrumentales e históricos), Andes Centrales, San Juan, Argentina: Boletín de la Sociedad Geológica Mexicana, 64 (2), 215-228. http://dx.doi.org/10.18268/BSGM2012v64n2a7
Ortuño, M., Zúñiga, F.R., Aguirre-Díaz, G.J., Carreón-Freyre, D., Cerca, M., Roverato, M., 2015, Holocene paleo-earthquakes recorded at the transfer zone of two major faults: the Pastores and Venta de Bravo faults (Trans-Mexican Volcanic Belt): Geosphere 11, 160–184. https://doi.org/10.1130/GES01071.1
Ortuño, M., Corominas, O., Villamor, P., Zúñiga, R.F., Lacan, P., Aguirre-Díaz, G., Perea, H., Štěpančíková, P., Ramírez-Herrera, M.T., 2019, Evidence of recent ruptures in the central faults of the Acambay Graben (central Mexico): Geomorphology, 326, 17–37. https://doi.org/10.1016/j.geomorph.2018.07.010
Pasquarè, G., Garduño, V.H., Tibaldi, A., Ferrari, M., 1988, Stress pattern evolution in the Central Sector of the Mexican Volcanic Belt: Tectonophysics, 146, 352-364. https://doi.org/10.1016/0040-1951(88)90099-6
Pauselli, C., Federico, C., Frigeri, A., Orosei, R., Barchi, M. R., Basile, G., 2010, Ground penetrating radar investigations to study active faults in the Norcia Basin (central Italy): Journal of Applied Geophysics, 72, 39-45. https://doi.org/10.1016/j.jappgeo.2010.06.009
Pellerin, C.L.M., Christensen, N.I., 1998, Interpretation of crustal seismic velocities in the San Gabriel-Mojave region, southern California: Tectonophysics, 286, 253-271. https://doi.org/10.1016/S0040-1951(97)00269-2
Pérez-Esquivias, H., Macías, J.L., Garduño-Monroy, V.H., Arce, J.L., García-Tenorio, F., Castro-Govea, R., Layer, P., Saucedo, R., Martínez, C., Jiménez-Haro, A., Valdez, G., Meriggi, L., Hernández, R., 2010, Estudio vulcanológico y estructural de la secuencia estratigráfica Mil Cumbres y del campo de Los Azufres, Michoacán: Geotermia, 23, 51-63.
Pradal, E., Robin, C., 1994, Long-lived magmatic phases at Los Azufres volcanic center, Mexico: Journal of Volcanology and Geothermal Research, 63 (3-4), 201-215. https://doi.org/10.1016/0377-0273(94)90074-4
Pueyo Anchuela, Ó., Lafuente, P., Arlegui, L., Liesa, C.L., Simón J.L., 2016, Geophysical characterization of buried active faults: the Concud Fault (Iberian Chain, NE Spain): International Journal of Earth Sciences, 105, 2221–2239. https://doi.org/10.1007/s00531-015-1283-y
Rashed, M., Kawamura, M.G., Hiroo, N., Miyata, T., Nakagawa, K., 2003. Ground penetrating radar investigation across Uemachi fault, Osaka, Japan: Journal of Applied Geophysics, 53, 63–75. https://doi.org/10.1016/S0926-9851(03)00028-4
Robinson, M., Bristow, C., McKinley, J, Ruffell, A., 2013, Ground Penetrating Radar: Geomorphological Techniques, British Society for Geomorphology, Part 1, sec 5.5, 1-26.
Rodríguez-Pérez, Q., Zúñiga, F.R., 2017, Seismicity characterization of the maravatío-Acambay and Actopan regions, Central Mexico: Journal of South American Earth Sciences, 76, 264–275. https://doi.org/10.1016/j.jsames.2017.03.013.
Sandmeier, K. J., 2016, Reflexw – GPR and seismic processing software. Sandmeier geophysical research 2020 [cit. 2020-09-05]. Available on: http://www.sandmeier-geo.de/reflexw.html
Shah, M., Sircar, A., Vaidya, D., Sahajpal, S., Chaudhary, A., Dhale, S., 2015, Overview of geotermal surface exploration methods: International Journal of Advance Research and Innovative Ideas in Education (IJARIIE), 1 (4), 55-64.
Skrame, K., Di Filippo, M., Di Nezza, M., 2016, Contribution of the Magnetic Horizontal Gradient Operator (MHGO) for the Interpretation of the Magnetic Anomalies, in Conference Proceedings, Near Surface Geoscience 2016 - 22nd European Meeting of Environmental and Engineering Geophysics, cp-495-00113. https://doi.org/10.3997/2214-4609.201602014
Soria-Caballero, D. C., Garduño-Monroy, V. H., Alcalá, M., Velázquez-Bucio, M. M., Grassi, L., 2019, Evidence for quaternary seismic activity of the La Alberca-Teremendo fault, Morelia region, Trans-Mexican Volcanic Belt: Revista Mexicana de Ciencias Geológicas, 36(2), 242-258. https://doi.org/10.22201/cgeo.20072902e.2019.2.1092
Suárez, G., 1992, El sismo de Jalapa del 3 de Enero de 1920: Revista de Ingeniería Sísmica, 42, 3–15. https://doi.org/10.18867/ris.42.290
Suárez, G., Novelo-Casanova, D.A., 2018, A pioneering Aftershock study of the destructive 4 January 1920 Jalapa, México, earthquake: Seismological Research Letters, 89 (5), 1894–1899. https://doi.org/10.1785/0220180150
Suárez, G., Caballero‐Jiménez, G.V., Novelo‐Casanova, D.A., 2019, Active crustal deformation in the Trans‐Mexican Volcanic Belt as evidenced by historical earthquakes during the last 450 years: Tectonics, 38, 1–19. https://doi.org/10.1029/2019TC005601
Suárez, G., Ruiz‐Barón, D., Chico‐Hernández, C., Zúñiga, F. R., 2020, Catalog of preinstrumental earthquakes in central Mexico: epicentral and magnitude estimations based on macroseismic data: Bulletin of the Seismological Society of America, 110(6), 3021-3036. https://doi.org/10.1785/0120200127
Sunyé-Puchol, I., Lacan, P., Ortuño, M., Villamor, P., Audin, L., Zúñiga, F.R., Langridge, R.M., Lawton, T.F., 2015, La Falla San Mateo: nuevas evidencias paleosismológicas de fallamiento activo en el Graben de Acambay, México: Revista Mexicana de Ciencias Geológicas, 32, 361–376.
Suter, M., 2016, Structure and Holocene rupture of the Morelia fault, trans‐Mexican volcanic belt, and their significance for seismic‐hazard assessment: Bulletin of the Seismological Society of America, 106, 2376–2388. https://doi.org/10.1785/0120160092
Suter, M., 2019, Macroseismic study of the devastating 22– 23 October 1749 earthquake doublet in the Northern Colima Graben (Trans-Mexican Volcanic Belt, Western Mexico): Seismological Research Letters, 90(6), 2304-2317. https://doi.org/10.1785/0220190162
Suter, M., Quintero, O., Johnson, C. A., 1992, Active faults and state of stress in the central part of the Trans-Mexican Volcanic Belt, Mexico 1. The Venta de Bravo fault: Journal of Geophysical Research, 97, 11983–11993. https://doi.org/10.1029/91JB00428
Suter, M., Quintero-Legorreta, O., López-Martínez, M., Aguirre-Díaz, G.J., Farrar, E., 1995, The Acambay graben: active intra arc extension in the trans-Mexican volcanic belt, Mexico: Tectonics, 14, 1245–1262. https://doi.org/10.1029/95TC01930
Suter, M., Carrillo-Martínez, M., Quintero-Legorreta, O., 1996, Macroseismic study of shallow earthquakes in the central and eastern parts of the trans-Mexican volcanic belt, Mexico: Bulletin of the Seismological Society of America, 86 (6), 1952-1963.
Suter, M., López-Martínez, M., Quintero-Legorreta, O., Carrillo-Martínez, M., 2001, Quaternary intra-arc extension in the central Trans-Mexican volcanic belt: Geological Society of America Bulletin, 113 (6), 693–703. https://doi.org/10.1130/0016-7606(2001)113<0693:QIAEIT>2.0.CO;2
Tatiana, F.Q., Angelo, S., 1998, Exploration of a lignite bearing in Northern Ireland, using Maurizio ground magnetic: Geophysics, 62 (4), 1143-1150. https://doi.org/10.1190/1.1443777
Terzic R. Z., Quigley C. M., Lopez F., 2017, Detailed Seismic Hazard assessment of Mt Bold area: comprehensive site-specific investigations on Willunga Fault: ANCOLD 2017 Conference Proceedings, The Australian National Committee.
Terzic, Z., Ermakov, O., Urosevic, M., 2019, Geophysical Survey as a part of a Multi-tiered Investigation in Fault Characterization and Dam Seismic Hazard Assessment – a case study from South Australia (online). Available in:http://rayfract.com/pub/TERZIC_ERMAKOV_UROSEVIC_AGS_Paper.pdf. Accessed on 23rd November 2020.
Urbina, F., Camacho, H., 1913, La zona megaseísmica Acambay-Tixmadejé, Estado de México, conmovida el 19 noviembre 1912: Boletín del Instituto Geológico de México, 32, 125.
Wallace, S.C., Nobes, D.C., Davis, K.J., Burbank, D.W., White, A., 2010, Three-dimensional GPR imaging of the Benmore anticline and stepover of the Ostler Fault, South Island, New Zealand: Geophysical Journal International, 180, 465-474. https://doi.org/10.1111/j.1365-246X.2009.04400.x
Xavier, P. M., Gibson, P., 2011, Electrical resistivity and Ground Penetrating Radar for the characterization of the internal architecture of Quaternary sediments in the Midlands of Ireland: Journal of Applied Geophysics, 75 (4), 638-647. https://doi.org/10.1016/j.jappgeo.2011.09.019
Yan Z., Clayton R.W., Saleeby J., 2005, Seismic refraction evidence for steep fault cutting highly attenuated continental basement in the central Transverse ranges, California: Geophysical Journal International, 160, 651–666. https://doi.org/10.1111/j.1365-246X.2005.02506.x
Zelt, C. A., Smith, R. B., 1992, Seismic traveltime inversion for 2-D crustal velocity structure: Geophysical Journal International, 108, 16–34. https://doi.org/10.1111/j.1365-246X.1992.tb00836.x
Zúñiga, F. R., Lacan, P., Rodríguez-Pérez, Q., Márquez-Ramírez, V. H., 2020, Temporal and spatial evolution of instrumented seismicity in the Trans-Mexican Volcanic Belt: Journal of South American Earth Sciences, 98, 1-10. https://doi.org/10.1016/j.jsames.2019.102390
Manuscript received: September 15, 2020
Corrected manuscript received: December 20, 2020
Manuscript accepted: January 2, 2021
|
Boletín de la Sociedad Geológica Mexicana Volumen 72, núm. 2, A271019, 2020 |
|
Crustacea (Isopoda, Anomura, Brachyura) from the Cretaceous of Soh area (NW Isfahan) Central Iran
Crustacea (Isopoda, Anomura, Brachyura) del Cretácico de la región de Soh (NW de Isfahán) Irán Central
Ali Bahrami 1, Mehdi Yazdi 1, Oscar González-León 2,3, María de Lourdes Serrano-Sánchez 4, Francisco J. Vega 4,*
1 Department of Geology, University of Isfahan, POB. 81746-73441, Isfahan, I.R. Iran.
2 Posgrado en Ciencias de la Tierra, Universidad Nacional Autónoma de México, Ciudad Universitaria, Coyoacán, 04510, CDMX, Mexico.
3 Facultad de Estudios Superiores Iztacala, Universidad Nacional Autónoma de México, Tlalnepantla, 54070, Estado de México, Mexico.
4 Instituto de Geología, Universidad Nacional Autónoma de México, Ciudad Universitaria, Coyoacán, 04510, CDMX, Mexico.
* Corresponding author: (F. J. Vega) This email address is being protected from spambots. You need JavaScript enabled to view it.
How to cite this article:
Bahrami, A., Yazdi, M., González-León, O., Serrano-Sánchez, M. L., Vega, F. J., 2020, Crustacea (Isopoda, Anomura, Brachyura) from the Cretaceous of Soh area (NW Isfahan) Central Iran: Boletín de la Sociedad Geológica Mexicana, 72 (2), A271019. http://dx.doi.org/10.18268/BSGM2020v72n2a271019
Abstract
The second fossil isopod from Iran is herein reported. Additional specimens of the small lobster Huhatanka iranica Bahrami and Vega in Yazdi et al. (2010) are also revised. The aforementioned allows differentiating this species from the only other known species, H. kiowana (Scott, 1970) from the Albian of Kansas, USA. Some indeterminate callianassoids, found associated with the isopod and H. iranica, are also reported.
Keywords: Crustacea, Isopoda, Decapoda, Albian, Isfahan, Iran.
Resumen
Se reporta el segundo registro de isópodo fósil para Irán, así como varios ejemplares complementarios de la langosta Huhatanka iranica Bahrami y Vega en Yazdi et al. (2010), lo cual permite diferenciar a esta especie de la otra especie del género, H. kiowana (Scott, 1970) del Albiano de Kansas, USA. Algunos callianassoideos, asociados al isópodo y H. iranica, son reportados.
Palabras clave: Crustacea, Isopoda, Decapoda, Albiano, Isfahán, Irán.
- Introduction
Cretaceous crustaceans from Iran are relatively scarce and have been reported by Feldmann et al. (2007), Yazdi et al. (2009, 2010), and McCobb and Hairapetian (2009). The present contribution reports the first isopod from late Albian deposits of central Iran, represented by a single, posterior molt specimen, attributed to Natatolana sp. Additional specimens of the mecochirid Huhatanka iranica Bahrami and Vega in Yazdi et al. (2010), from the late Albian of Soh area, allow describing some morphological details lacking in the first report by Yazdi et al. (2010). These new specimens are compared with the type specimens of H. kiowana (Scott, 1970) from the Albian of Kansas, described by Feldmann and West (1978).
- Geology and stratigraphy
The Iranian Plate, a major segment of the Cimmerian microcontinent, had detached from northeastern Gondwana by the end of Permian and collided with the Turan Plate (part of Eurasia) towards the end of the Triassic (Sengore, 1990; Stampfli et al., 1991; Saidi et al., 1997; Mirnejad et al., 2013). From the Early Jurassic to Senonian, the young Neo-Tethyan oceanic basin was reduced in extent by its subduction under the Iranian continental plate. The final closure of the Neo-Tethys, marked by the collision between the Iranian and Arabian plates, took place during the Neogene (Berberian et al., 1982; Shahabpour, 2005; Ahmadi Khalaji et al., 2007). The Iranian plateau is divided into several zones from SW to NE (Figure 1): Zagros fold-thrust belt, Sanandaj–Sirjan metamorphic zone, Urumieh–Dokhtar volcanic belt, central Iran zone, Alborz zone, Kopeh Dagh zone, and Eastern Iran zone (Falcon, 1967; Stocklin, 1968; Dewey et al., 1973; Stocklin and Nabavi, 1973; Jackson and McKenzie, 1984; Sengore, 1984; Byrne et al., 1992; McCall, 2002; Blanc et al., 2003; Alavi, 2004; Walker and Jackson, 2004). The study area is located in Central Iran (Figure 1).
-A271019_Bahrami-Vega/A271019_Bahrami-Vega-Image_001.jpg) |
| Figure 1. Structural map of central Iran (modified from Bahrami et al., 2018). |
Following the late Cimmerian orogeny, the Early Cretaceous sea advanced onto the small continent of Central Iran, the transgression in the Soh area began in the late Barremian and continued to the early Albian (Zahedi, 1973). A sequence of thick sediments eroded by this uplift included several lithologies such as red conglomerate, sandstones, and limestones (Yazdi et al., 2010). Orbitolina gray limestones with marl intercalations are late Aptian in age (Khodaverdi et al., 2016) (Figures 2 and 3). Shales with intercalations of limestone contain ammonites, green to gray marly limestone with nodules that include Huhatanka iranica, the here described isopod, small turritellid gastropods; and nuculid bivalves (De Grave, 2009). Thick, micritic Turonian limestones overlie the crustacean beds (Figure 3). The youngest sequence (Eocene and Oligo-Miocene, Qom Formation) can be observed anywhere in the plain (Khodaverdi et al., 2016). An angular unconformity is present between the Pliocene and the Pleistocene (clastic and travertine), and different ages below this sequence can be traced throughout the area. This angular unconformity is a result of the final alpine orogenic phase. The studied section (Figures 3, 4) is located near the village of Soh (70 km northwest of Isfahan) and is accessible by a 35 km unpaved road off the Isfahan–Tehran highway. The section is on the right side of a seasonal river valley. Coordinates for the fossil locality are N 33°27′9″, E 51°28′32″. Structurally, the locality belongs to the Central Iran microplate, which is restricted by the NW–SE Sanandaj-Sirjan metamorphic belt to the west, and by the Great Kavir fault to the East.Specimens reported here are held in the Department of Geology, Faculty of Sciences, University of Isfahan, 81746, Iran, under acronym IUMC, and in the paleontological collection of Kent State University (KSU), Kent, Ohio (USA).
-A271019_Bahrami-Vega/A271019_Bahrami-Vega-Image_002.jpg) |
| Figure 2. Location and geologic maps of the study area with position of fossil locality (arrow), northwest of Isfahan, Iran. |
Abbreviations: a = branchiocardiac groove, ac = antennal carina, b = antennal groove, b1 = hepatic groove, c = postcervical groove, cd = cardiac groove, e1e = cervical groove, en = endopod, ex = exopod, gc = gastro-orbital carina, mc = median carina, oc = orbital carina, P1-P5 = pereiopods 1-5, s1-s6 = pleonal somites (i-v in Figure 5), Te = telson, VII-V = pereonal somites in Figure 5.
-A271019_Bahrami-Vega/A271019_Bahrami-Vega-Image_003.jpg) |
| Figure 3. Stratigraphic section of the study area, indicating position of reported specimens. |
- Systematic palaeontology
Class Malacostraca Latreille, 1802
Order Isopoda Latreille, 1817
Suborder Cymothoida Wägele, 1989
Family Cirolanidae Dana, 1853
Genus Natatolana Bruce, 1981
Type species: Cirolana hirtipes H. Milne
Edwards, 1840, by original designation, not subsequent designation as stated by
Brusca et al. (1995).
Natatolana sp.
Figure 5A to 5C
-A271019_Bahrami-Vega/A271019_Bahrami-Vega-Image_004.jpg) |
|
Figure 4. Panoramic view of the Albian greenish shales with nodular concretions containing Crustacea. |
Description: Small posterior exuvia, smooth, preserving pereonites V–VII, pleonites i–v, pleotelson, left pereopod 7 and uropods. Pereonites V–VII semirectangular, represent less than half the maximum length and maximum width, all of about same length and width. Pleon represents about one third the maximum length and about two thirds the maximum width; pleonites with triangular, acute posterolateral margins. Pleotelson sub-triangular, two-thirds the maximum length and half the maximum width, with rounded posterior margin. Left pereopod 7 incompletely preserved, only propodus and acute dactylus. Uropods wide, peduncle apparently narrow; exopod narrow, lanceolate, about half the length of endopod and one-third its maximum width; margins smooth; endopod wide, subovate, rounded margins, extend to level of posterior tip of pleotelson.
Material: One specimen, IUMC-100.
Measurements: length = 15.3 mm, width = 9.4 mm.
Discussion: The specimen represents the second record for a fossil isopod from Iran. Recently Hyžný et al. (2019) reinterpreted crustacean remains thought to be lobster remains from the Early Cretaceous of Iran (Feldmann et al., 2007). Other similar cirolanid representatives reported from Cretaceous, Paleogene, and Neogene deposits around the world include Cymothoidana websteri Jarzembowski et al. (2014) from the Hauterivian-Barremian of China, Spain, and the United Kingdom. More recently, Vega et al. (2019) reported undetermined cirolanid isopods from the Early Cretaceous of Puebla, Mexico, associated with posterior exuviae of Natatolana poblana Bruce and Vega (2019, in Vega et al., 2019), which differs from the studied specimen in having smaller and narrower uropods. Additional and more complete Iranian specimens could confirm if they represent a new or already known species of Natatolana.
Order Decapoda Latreille, 1802
Suborder Pleocyemata Burkenroad, 1963
Infraorder Glypheidea Zittel, 1885
Superfamily Glypheoidea Zittel, 1885
Family Mecochiridae Van Straelen, 1924
Genus Huhatanka Feldmann and West, 1978
Type species: Squilla? kiowana (Scott, 1970), by subsequent designation of Feldmann and West (1978).
Huhatanka iranica Bahrami and Vega in
Yazdi et al., 2010
Figures 6A, 6B, and 7
Huhatanka iranica Bahrami and Vega in Yazdi et al. (2010), p. 209, fig. 3.1–3.4.
-A271019_Bahrami-Vega/A271019_Bahrami-Vega-Image_005.jpg) |
| Figure 5. (A–C) Natatolana sp. (IUMC-100) from the late Albian in Central Iran. (A) Image, (B) inverted colour image, and (C) drawing of the almost complete posterior exuvia. (D) Comparison with posterior exuvia of Cirolana pueblaensis Vega and Bruce, 2019 in Vega et al., 2019, holotype IGM-11178, from the Early Cretaceous of Puebla, Mexico. |
Emended diagnosis: Small mecochirid, cephalothorax elongate, longer than high; posterior margin rimmed, curved; surface uniformly granulate; rostrum triangular, short; relatively weak median carina with fine tubercles extending from posterior portion of rostrum to cervical groove; a pair of parallel carinae extend from the lateral sides of rostrum to cervical groove; antennal region one-third carapace length, with three longitudinal carinae; cervical groove deep; oblique weak carina extends from dorsal portion of carapace on lower portion of cervical groove; postcervical, branchiocardiac, and hepatic grooves shallow; cardiac groove slightly deep; tubercles become finer on posterolateral side of carapace; s1 covered by granules; P1 slightly longer than P2-P5.
-A271019_Bahrami-Vega/A271019_Bahrami-Vega-Image_006.jpg) |
| Figure 6. (A–D) Images and drawings of specimens of Huhatnka iranica Yazdi, Bahrami and Vega, 2010 from the Albian of Iran (IUMC 101 and IUMC-102). (E–H) Images and drawings of specimens of Huhatnka kiowana (Scott, 1970) from the Albian of Kiowa Formation, Kansas, USA (KSU 3768). Scale bars = 5 mm. |
Emended description: Mecochirid of small size; carapace elongate, maximum height two thirds of maximum length, posterior margin rounded, rimmed, surface covered by relatively uniform tubercles; rostrum acute, triangular, bordered by finely granulate ridges that extend posteriorly to cervical groove; weaker median ridge also extends from tip of rostrum to cervical groove; antennal region one third the carapace length, with three granulate longitudinal carinas, middle and lower carinas stronger; cervical groove deep, inclined toward anterolateral margin; oblique weak ridge extends from dorsal portion of carapace to lower portion of cervical groove; branchiocardiac, hepatic and postcervical grooves shallow and parallel; cardiac groove slightly deep; tubercles become finer on posterolateral side of carapace, s1 and s2 similar size and shape; surface covered by granules; P1 longer than P2-P5, P2-P5 similar size an length.
-A271019_Bahrami-Vega/A271019_Bahrami-Vega-Image_007.jpg) |
| Figure 7. (A–F) Several specimens (part and counterpart) of Huhatnka iranica Yazdi, Bahrami and Vega, 2010 from the Albian of Iran (IUMC-101 to IUMC-105). Scale bars = 5 mm. |
Material: IUMC-101 to IUMC-105.
Measurements: IUMC-101, length = 61.2 mm, width = 8.9 mm; IUMC-102, length = 53.1 mm, width = 7.9 mm; IUMC-103, length = 42.3 mm, width = 7.8 mm; IUMC-104, length = 55.5 mm, width = 10.9 mm; IUMC-105, length = 38.8 mm, width = 8.7 mm
Discussion: The specimens confirm the differences previously suggested by Yazdi et al. (2010) between Huhatanka iranica and H. kiowana (Scott, 1970). It is clear that the specimens from the Albian of Iran have a more granulose carapace and pleonal surface, showing some morphological features as branchiocardiac, cardiac, and postcervical grooves not previously recognized by Yazdi et al. (2010).
Some of these features were considered weak or absent by Feldmann and West (1978) in their description of the genus. However, the specimens illustrated in Figure 6E to 6H show weakly the morphological features previously mentioned. According to Schweitzer et al. (2010) seven genera, Huhatanka (Feldmann and West, 1978), Jabaloya (Garassino et al., 2009), Mecochirus (Germar, 1827), ?Praeatia (Woodward, 1868), Pseudoglyphea (Oppel, 1861), ?Selenisca (Meyer, 1847), and Meyeria (M’Coy, 1849), now Atherfieldastacus (M’Coy, 1849) belong to the Mecochiridae Van Straelen, 1924.
However, Charbonnier et al. (2013) considered Selenisca as a junior synonym of Glyphea. This systematic treatment was confirmed by Chabonnier et al. (2015) from a phylogenetic analysis. Breton et al. (2015) described Meyeria houdardi and Meyeria sp. from the Albian strata east of the Paris Basin and Pays de Bray. However, we consider that the specimens described by Breton et al. (2015, fig. 1A-G, p. 58) show morphological features in the carapace and pleon more similar to Huhatanka than to Meyeria. Recently, Robin et al. (2016) suggested that Jabaloya aragonensis Garassino et al. (2009) has morphological features similar to those of Meyeria. Including some morphological features which are absent or modified in Meyeria and Mecochirus, Robin et al. (2016) assigned the new genus Atherfieldastacus within the Mecochiridae, suggesting the new combinations Atherfieldastacus magnus (M’Coy, 1849), A. mexicanus (Rathbun, 1935), A. rapax (Harbort, 1905), and A. schwartzi (Kitchin, 1908) for these species previously assigned to Meyeria. Based upon this combination, González-León et al. (2014) considered that Meyeria pueblaensis should be a junior synonym of Meyeria magna (now A. magnus).
Infraorder Thalassinidea Latreille, 1831
Superfamily Callianassoidea Dana, 1852
Family Callianassidae Dana, 1852
Genus and species indet.
Figure 8
Description: Major cheliped one-third larger than minor cheliped; palm of major cheliped subrectangular, highest near junction with carpus, smooth; dactylus triangular, one-third the length of palm and its width one-fifth the maximum palm height. Merus of minor cheliped subovate, narrower at junction with carpus; carpus subrectangular, twice as high as long, posterior margin curved; palm subrectangular elongate, one-third longer than high; fixed finger triangular, half the length of palm and one-fourth its height.
Material: UIC 3762 to EUIC 3766.
-A271019_Bahrami-Vega/A271019_Bahrami-Vega-Image_008.jpg) |
| Figure 8. (A–G) Several indeterminate callianassoid specimens from the Albian of Iran (IUMC-106 to IUMC-111). Scale bars = 5 mm. |
Measurements: EUIC 3762 left cheliped (merus + carpus + palm) length = 36.2 mm, height = 10.3 mm; EUIC 3763 left chela (merus + carpus) length = 18.5 mm, height = 9.8 mm; EUIC 3764 right palm length = 16.4 mm, height = 9.6 mm; EUIC 3765 right palm length = 22.1 mm, height = 12.2 mm; EUIC 3766 left palm length = 19.4 mm, height = 11.5 mm.
Discussion: Yazdi et al. (2009) reported Callianassoidea palm remains from the Albian of Kolah Qazi section - Beudanticeras shale, Central Iran. It is possible that these callianassoid remains are similar to those herein reported, but only complete and better-preserved material could solve the systematic assignment of the specimens left in open nomenclature.
- Conclusion
The new crustacean specimens collected from the Albian beds of Iran expand our knowledge of the crustacean assemblage of this region, including the first record of a fossil isopod. Aptian–Albian outcrops with concretions are potentially important for future findings, including potential new genera and species.
Acknowledgements
The authors are grateful to the Vice Chancellor for Research and Technology at the University of Isfahan, Iran for financial and logistic support. Our sincere gratitude to Dr. Rodney M. Feldmann, Kent State University, for sharing some images. We are in debt with Salvador Vázquez (BSGM) for his valuable editorial support.
References
Ahmadi Khalaji, A., Esmaeily, D., Valizadeh, M.V., Bonab, R.H., 2007, Petrology and geochemistry of the granitoid complex of Boroujerd, Sanandaj-Sirjan Zone, Western Iran: Journal of Asian Earth Sciences, 29(5-6), 859–877. https://doi.org/10.1016/j.jseaes.2006.06.005
Alavi, M., 2004, Regional stratigraphy of the Zagros fold‐thrust belt of Iran and its proforeland evolution: American Journal of Science, 304(1), 1–20. https://doi.org/10.2475/ajs.304.1.1
Bahrami, A., Königshof, P., Boncheva, I., Yazdi, M., Khalaji, M., Zarei, E., 2018, Conodont biostratigraphy of the Kesheh and Dizlu sections, and the age range of the Bahram Formation in Central Iran: Palaeobiodiversity and Palaeoenvironments, 98, 315–329. https://doi.org/10.1007/s12549-017-0307-y
Blanc, E.J.-P., Allen, M.B., Inger, S., Hassani, H., 2003, Structural styles in the Zagros Simple Folded Zone, Iran: Journal of the Geological Society, 160(3), 401–412. https://doi.org/10.1144/0016-764902-110
Berberian, F., Mure, I.D., Pankhurst, R.J. Berberian, M., 1982, Late Cretaceous and early Miocene Andean-type plutonic activity in northern Makran and central Iran: Journal of the Geological Society London, 139(5), 605–614. https://doi.org/10.1144/gsjgs.139.5.0605
Breton, G., Néraudeau, D., Dépré, E., 2015, Mecochiridae (Crustacea, Decapoda, Glypheidea) de l’Albien et du Cénomanien de France: Annales de Paléontologie, 101(1), 55–64. https://doi.org/10.1016/j.annpal.2015.01.001
Bruce, N.L., 1981, Redescription of the isopod (Crustacea) family Phoratopodidae: Beaufortia, 31, 107–110.
Brusca, R.C., Wetzer, R., France, S.C., 1995, Cirolanidae (Crustacea Isopoda Flabellifera) on the Tropical Eastern Pacific: Proceedings of the San Diego Society of Natural History, 30, 1-96.
Burkenroad, M.D., 1963, The evolution of the Eucarida, (Crustacea, Eumalacostraca), in relation to the fossil record: Tulane Studies in Geology, 2(1), 3–17.
Byrne, D.E, Sykes, L.R., Davis, D.M., 1992, Great thrust earthquakes and aseismic slip along the plate boundary of the Makran subduction zone: Journal of Geophysical Research – Solid Earth, 97(B1), 449–478. https://doi.org/10.1029/91jb02165
Charbonnier, S., Garassino, A., Schweigert, G., Simpson, M., 2013, A worldwide review of fossil and extant glypheid and litogastrid lobsters (Crustacea, Decapoda, Glypheoidea): Mémoires du Muséum National d’Histoire Naturelle, 205, 1–304.
Charbonnier, S., Audo, D., Barriel, V., Garassino, A., Schweigert, G., Simpson, M., 2015, Phylogeny of fossils and extant glypheid and litogastrid lobsters (Crustacea, Decapoda) as revealed by morphological characters: Cladistics, 31(3), 231–249. https://doi.org/10.1111/cla.12088
Dana, J.D., 1852, Conspectus Crustaceorum and Conspectus of the Crustacea of the Exploring Expedition under Capt. C. Wilkes, U.S.N. Macroura: Proceedings of the Academy of Natural Sciences of Philadelphia, 6, 10–28.
Dana, J.D., 1853, Crustacea. United States Exploring Expedition During the Years 1838, 1839, 1840, 1841, 1842. Under the Command of Charles Wilkes 14: 696-805, atlas, pls. 46-53.
De Grave, S., Pentcheff, N.D., Ahyong, S.T., Chan, T.-Y., Crandall, K.A., Dworschak, P.C., Felder, D.L., Feldmann, R.M., Fransen, C.H.M., Goulding, L.Y.D., Lemaitre, R., Low, M.E.Y., Martin, J.W., Ng, P.K.L., Schweitzer, C.E., Tan, S.H., Tshudy, D., Wetzer, R., 2009, A classification of living and fossil genera of decapod crustaceans: Raffles Bulletin of Zoology (Suppl. 21), 1–109.
Dewey, J.F., Pitman, W.C. III, Ryan, W.B.F., Bonnin, J., 1973, Plate tectonics and the evolution of the alpine system: Geological Society of America Bulletin, 84(10), 3137–3180. https://doi.org/10.1130/0016-7606(1973)84<3137:PTATEO>2.0.CO;2
Falcon, N.L., 1967, The geology of the northeast margin of the Arabian basement shield: Advancement of Science, 24, 31-42.Feldmann, R.M., Schweitzer, C.E., 2012, What ever happened to Selenisca (Decapoda)?: Bulletin of the Mizunami Fossil Museum 38, 9–14.
Feldmann, R.M., West, R.R., 1978, Huhatanka, a new genus of lobster (Decapoda: Mecochiridae) from the Kiowa Formation (Cretaceous: Albian) of Kansas: Journal of Paleontology, 52, 1219–1226.
Feldmann, R.M., Kolahdouz, A., Biranvand, B., Schweigert, G., 2007, A new family, genus and species of lobster (Decapoda: Achelata) from the Gadvan Formation (Early Cretaceous) of Iran: Journal of Paleontology, 81(2), 405–407. https://doi.org/10.1666/0022-3360(2007)81[405:anfgas]2.0.co;2
Garassino, A., Artal, P., Pasini, G., 2009, Jabaloya aragonensis n. gen., n. sp. (Crustacea, Decapoda, Mecochiridae) and Cedrillosia jurassica n. gen., n. sp. (Crustacea, Decapoda, Glypheidae) from the Upper Jurassic of Teruel Province (Aragón, Spain): Atti della Società Italiana di Scienze Naturali e del Museo Civico di Storia Naturale di Milano, 150(II), 197–206.
Germar, E.F., 1827, Über die Versteinerungen von Solenhofen. Keferstein’s Deutschland geognostisch-geologisch Dargestellt, 4, 89–112.
González-León, O., Moreno-Bedmar, J.A., Vega, F.J., 2014, Morphology and ontogeny of the fossil lobster Meyeria magna M’Coy, 1849 (Astacidae, Mecochiridae) from the Lower Cretaceous (Lower Aptian) of Mexico, United Kingdom and Spain: Neues Jahrbuch für Geologie und Palaeontologie Abhandlungen, 271(1), 49–68. https://doi.org/10.1127/0077-7749/2014/0376
Harbort, E., 1905, Die Fauna der Schaumburg-Lippèschen Kreidemulde: Abhandlungen der Preussischen Geologischen Landesanstalt, neue Folge 14, 10–22.
Hyžný, M., Audo, D., Feldmann, R.M., Schweigert, G., 2019, Tricarina gadvanensis is an isopod: reinterpretation of an alleged lobster from the Lower Cretaceous of Iran: Journal of Paleontology, 1-7. https://doi.org/10.1017/jpa.2019.61
Jackson, J.A., McKenzie, D., 1984, Active tectonics of the Alpine-Himalayan Belt between western Turkey and Pakistan: Geophysical Journal of the Royal Astronomical Society, 77(1), 185–264. https://doi.org/10.1111/j.1365-246x.1984.tb01931.x
Jarzembowski, E.A., Wang, B., Fang, Y., Zhang, H., 2014, A new aquatic crustacean (Isopoda: Cymothoida) from the early Cretaceous of southern England and comparison with the Chinese and Iberian biotas: Proceedings of the Geologists Association, 125(4), 446-451. http://doi.org/10.1016/j.pgeola.2014.08.001
Khodaverdi Hassan-vand, M., Bahrami, A., Yazdi, M., Ossó, À., Safari, A., Martínez, J.L., Vega, F., 2016, Occurrence of Retrocypoda almelai Via Boada, 1959 (Decapoda: Retroplumidae) in the Eocene of Central Iran: Paleontología Mexicana, 5(1), 21-31.
Kitchin, F.L., 1908, The invertebrate fauna and palaeontological relations of the Uitenhage series: Annals of the South African Museum, 7, 212–268. https://doi.org/10.5962/bhl.title.26289
Latreille, P.A., 1802, Histoire naturelle, générale et particulière des Crustacés et des Insectes. Ouvrage faisant suite à l’histoire naturelle générale et particulière, composée par Leclerc de Buffon, et rédigée par C.S. Sonnini, membre de plusieurs sociétés savantes. Familles naturelles des genres, 3, 467 pp. Paris (Dufart). https://doi.org/10.5962/bhl.title.15764
Latreille, P.A., 1817, Les crustacés, les arachnides et les insects, in Cuvier, G. (ed.), Le règne animal distribute d’après son organization, pour server de base à l’histoire naturelle des animaux et d’introduction à l’anatomie compare, edition 1, vol. 3: Déterville, Paris, 653 p.
Latreille, P.A., 1831, Cours d’entomologie, ou de l’histoire naturelle des Crustacés, des Arachnides, des Myriapodes et des Insectes, etc. Annales I. Atlas. Roret, Paris. 26 pp.
McCall, G.J.H., 2002, A summary of the geology of the Iranian Makran, in Clift, P.D., Kroon, F.D., Gaedecke, C., Craig, J. (eds.), The Tectonic and Climatic Evolution of the Arabian Sea Region: Special Publication of the Geological Society, 195(1), 147–204. https://doi.org/10.1144/gsl.sp.2002.195.01.10
McCobb, L.M.E., Hairapetian, V., 2009, A new lobster Paraclytia valashtensis (Crustacea, Decapoda, Nephropidae) from the Late Cretaceous of the central Alborz Range, Iran: Paläontologische Zeitschrift, 83(3), 419–430. https://doi.org/10.1007/s12542-009-0033-5
M’Coy, F., 1849, On the classification of some British fossil Crustacea, with notices of new forms in the University Collection at Cambridge: The Annals and Magazine of Natural History, 4(23), 330–335. https://doi.org/10.1080/03745486009494843
Meyer, H. Von., 1847, Halycine and Litogaster, zwei Crustaceen–Gattungen aus dem Muschelkalke Württembergs: Palaeontographica, 1, 134–140.
Milne-Edwards, H., 1840, Histoire Naturalle des Crustaces 3. 1-638. Paris: Roret.
Mirnejad, H., Lalonde, A.E., Obbeid, M., Hassansadeh, J., 2013, Geochemistry and Petrogenesis of Mashhad Granitoid: An Insight into the Geodynamic History of Paleo-Tethys in Northeast of Iran: Lithos, 170, 105–116. https://doi.org/10.1016/j.lithos.2013.03.003
Oppel, A., 1861, Die Arten der Gattungen Glyphea und Pseudoglyphea: Jahreshefte des Vereins für Vaterländische Naturkunde in Württemberg, 17, 108-111.
Rathbun, M.J., 1935, Fossil Crustacea of the Atlantic and Gulf Coastal Plain, Geological Society of America Special Paper, 2, 1–160. https://doi.org/10.1130/spe2-p1
Robin, N., Charbonnier, S., Merle, D., Simpson, M., Petit, G., Fernandez, S., 2016, Bivalves on mecochirid lobsters from the Aptian of the Isle of Wight: snapshot on an Early Cretaceous palaeosymbiosis: Palaeogeography, Palaeoclimatology, Palaeoecology, 453, 10–19. https://doi.org/10.1016/j.palaeo.2016.03.025
Saidi, A., Brunet, M.F., Ricou, L.E., 1997, Continental accretion of the Iran Block to Eurasia as seen from Late Paleozoic to Early Cretaceous subsidence curves: Geodinamica Acta, 10, 189–208. https://doi.org/10.1080/09853111.1997.11105302
Schweitzer, C.E., Feldmann, R.M., Garassino, A., Karasawa, H., Schweigert, G., 2010, Systematic List of Fossil Decapod Crustacean Species: Crustacea Monographs, 10, 1–230. https://doi.org/10.1163/ej.9789004178915.i-222
Scott, R.W., 1970, Paleoecology and paleontology of the Lower Cretaceous Kiowa Formation, Kansas: Kansas, U.S.A., The University of Kansas Paleontological Contributions, 52, 1–94.
Sengore, A.M.C., 1984, The Cimmeride Orogenic System and the Tectonics of Eurasia: Geological Society of America Special Paper, 195, 1–82. https://doi.org/10.1130/spe195
Sengore, A.M.C., 1990, A new model for the late Palaeozoic–Mesozoic tectonic evolution of Iran and implications for Oman, in Robertson, A.H.F., Searle, M.P., Ries, A.C. (eds.), The Geology and Tectonics of the Oman Region: Geological Society of London, Special Publications, 49(1), 797–831. https://doi.org/10.1144/gsl.sp.1992.049.01.49
Shahabpour, J., 2005, Tectonic evolution of the orogenic belt in the region located between Kerman and Neyriz: Journal of Asian Earth Sciences, 24(4), 405–417. https://doi.org/10.1016/j.jseaes.2003.11.007
Stampfli, G., Marcoux, J., Baud, A., 1991, Tethyan margins in space and time: Palaeogeography, Palaeoclimatology, Palaeoecology, 87(1-4), 373–409. https://doi.org/10.1016/0031-0182(91)90142-e
Stocklin, J., 1968, Structural history and tectonics of Iran: a review: The American Association of Petroleum Geologists, Bulletin, 52(7), 1229–1258. https://doi.org/10.1306/5d25c4a5-16c1-11d7-8645000102c1865d
Stocklin, J., Nabavi, M.H., 1973, Tectonic Map of Iran 1:2500000: Geological Survey of Iran.
Van Straelen, V., 1924, Contribution à l’étude des crustacés décapodes de la Période Jurassique: Brussels: Mémoires de l’Académie Royale de Belgique, Classe des Sciences, series 2, 462 p.
Vega, F.J., Bruce, N.L., González-León, O., Jeremiah, J., Serrano-Sánchez, M.L., Alvarado-Ortega, J., Moreno-Bedmar, J.A., 2019, Lower Cretaceous marine isopods (Isopoda: Cirolanidae, Sphaeromatidae) from the San Juan Raya and Tlayúa formations, Puebla, Mexico: Journal of Crustacean Biology, 39(2), 121–135. https://doi.org/10.1093/jcbiol/ruy107
Wägele, J.W., 1989, Evolution und phylogenetisches System del Isopods. Stand der Forschung und neue Erkenntnisse: Zookogica (Stuttgart), 140, 1–262.
Walker, R., Jackson, J., 2004, Active tectonics and late Cenozoic strain distribution in central and eastern Iran: Tectonics, 23(5), 1–24. https://doi.org/10.1029/2003tc001529
Woodward, H., 1868, Fourth report on the structure and classification of the fossil Crustacea: Report of the British Assocation of Advancement of Science, 72–75.
Yazdi, M., Bahrami, A., Vega, F.J., 2009, Albian decapod Crustacea from Southeast Isfahan, Central Iran-Kolah-Qazi area: Bulletin of the Mizunami Fossil Museum, 35, 71–77.
Yazdi, M., Bahrami, A., Vega, F.J., 2010, Additions to Albian (Cretaceous) Crustacea from Iran: Boletín de la Sociedad Geológica Mexicana, 62(2), 207–211. https://doi.org/10.18268/bsgm2010v62n2a1
Zahedi, M., 1973, Ètude gèologique de la règion de Soh (W de l’Iran Central): Geological Survey of Iran, Report, 27, 1–197.
Zittel, K.A., 1885, Handbuch der Palaeontologie, 1. Abtheilung Palaeozoologie, Band 2, Mollusca and Arthropoda: München and Liepzig, R. Oldenbourg, 525–721.
Manuscript received: September 08, 2019
Corrected manuscript received: October 25, 2019
Manuscript accepted: October 30, 2019
|
Boletín de la Sociedad Geológica Mexicana Volumen 72, núm. 2, A300719, 2020 |
|
Evidence of large Anacardiaceae trees from the Oligocene–early Miocene Santiago Formation, Azuero, Panama
Evidencia de árboles grandes de Anacardiaceae del Oligoceno-Mioceno temprano en la Formación Santiago, Azuero, Panamá
Oris Rodríguez-Reyes1,2,*, Emilio Estrada-Ruiz3, Peter Gasson4
1Facultad de Ciencias Naturales, Exactas y Tecnología, Departamento de Botánica, Universidad de Panamá. Apartado 00017, 0824, Panama.
2Smithsonian Tropical Research Institute, Box 0843-03092, Balboa, Ancón Republic of Panama, Panama.
3Departamento de Zoología, Laboratorio de Ecología, Escuela Nacional de Ciencias Biológicas, Instituto Politécnico Nacional, Prolongación de Carpio y Plan de Ayala s/n, 11340, CDMX, Mexico.
4Royal Botanic Gardens, Kew, Richmond, Surrey TW93AB, United Kingdom.
*Corresponding author: (O. Rodrguez-Reyes) This email address is being protected from spambots. You need JavaScript enabled to view it.
How to cite this article:
Rodríguez-Reyes, O., Estrada-Ruiz, E., Gasson, P., 2020, Evidence of large Anacardiaceae trees from the Oligocene–early Miocene Santiago Formation, Azuero, Panama: Boletín de la Sociedad Geológica Mexicana 72(2), A300719. http://dx.doi.org/10.18268/BSGM2020v72n2a300719
Abstract
We have poor knowledge of the plants that inhabited Central America during the Cenozoic. One of the families with a rich fossil record worldwide, especially for the Oligocene and Miocene epochs is Anacardiaceae. Llanodelacruzoxylon sandovalii gen. et sp. nov. is the first formal record of a fossil wood of Anacardiaceae found in Panama and Central America to date. We collected the fossil woods in the Oligocene–Miocene Santiago Formation, in the Azuero Peninsula, Panama. Among the samples collected we have described and identified this new fossil genus of Anacardiaceae, using wood anatomical characters and extensive comparisons with fossil and extant material. These two specimens share diagnostic features with several Anacardiaceae woods, such as: large vessels (>200 µm), simple vessel-ray pitting and rays mostly uniseriate with large crystals. The occurrence of these Anacardiaceae in Panama by the Oligocene to Miocene adds to the understanding of the historical biogeography of the family and supports Central America (including Mexico) being a divergence center of the Anacardiaceae.
Keywords: Anacarcadiaceae, Oligocene–Miocene, fossil wood, Santiago Formation, Panama.
Resumen
Tenemos poco conocimiento de las floras que habitaron América Central durante el Cenozoico. Anacardiaceae es una de las familias con un abundante registro fósil a nivel mundial, especialmente para el Oligoceno y Mioceno. Llanodelacruzoxylon sandovalii gen. et sp. nov. es el primer registro de una madera fósil de Anacardiaceae encontrada en Panamá y América Central hasta ahora. Recolectamos las maderas fósiles en la Formación Santiago, Península de Azuero, Panamá. Describimos e identificamos estos especímenes como Anacardiaceae, usando caracteres anatómicos de la madera y extensas comparaciones de material fósil y moderno. Estos dos especímenes comparten características diagnósticas con maderas de Anacardiaceae, como son: vasos grandes (>200 µm), punteaduras vaso-radiales simples y radios uniseriados con cristales grandes. La presencia de Anacardiaceae en Panamá para el Oligoceno-Mioceno, ayuda a entender la historia biogeográfica de la familia y soporta la idea de América Central (incluyendo México) como un centro de divergencia de Anacardiaceae.
Palabras clave: Anacarcadiaceae, Oligoceno–Mioceno, Madera fósil, Formación Santiago, Panamá.
1. Introduction
Anacardiaceae and Burseraceae (Sapindales) provide an excellent opportunity for investigating the biogeographic history of tropical diversification and the relative importance of movement and climatic adaptation in angiosperm evolution (Weeks et al., 2014). These families occur on every continent except Oceania and Antarctica and are major elements of temperate, seasonally dry tropical forests and tropical wet forests (Gentry, 1988; Pennington et al., 2010). Although these two families have approximately the same number of species, the Anacardiaceae occupy a wider range of habitats (Weeks et al., 2014).
Anacardiaceae/Burseraceae have a long evolutionary history. Xie et al. (2014) suggested the divergence occurred approximately 73 Ma, based on the oldest fossil record of Anacardiaceae (Estrada-Ruiz et al., 2010). The fossil record of Anacardiaceae is extensive worldwide (Stevens, 2001 onwards), with approximately 80 specimens associated with the family (e.g., Kruse, 1954; Wheeler and Manchester, 2002; Martínez-Cabrera and Cevallos-Ferriz, 2004; Gregory et al., 2009; Estrada-Ruiz et al., 2010; Pérez-Lara et al., 2017; Woodcock et al., 2017). The majority of these records are from South America and Asia (Weeks et al., 2014).
There are only two reports of fossil Anacardiaceae from Panama, both discovered in the Azuero Peninsula: Dracontomelon L. endocarps from the Eocene Tonosí Formation (Herrera et al., 2012) and one fossil wood that resembles Anacardiaceae/Burseraceae from the Oligocene-Miocene Santiago Formation, found in the surrounds of the Ocú town (Jud and Dunham, 2017).
Here we report the largest fossil trunk discovered in Panama and probably, Central America, to date. The wood has several features that support an affinity to the Anacardiaceae, although they are not found in any specific extant genus. Consequently, we erect a new fossil-genus and species of Anacardiaceae.
This new record is presented as additional evidence that Central America (including Mexico) was a divergence center of the Anacardiaceae.
2. Materials and methods
The two specimens reported herein were collected in the Veraguas province in Panama. STRI 44038B is a large trunk collected on a private farm in Llano de La Cruz (latitude 08° 09’ 4.7” N; longitude 80° 53’ 11.2” W) (Figure 1).
|
|
|
Figure 1. A) Map of Panama and the Azuero Peninsula, and B) It shows the Holotype collection locality. |
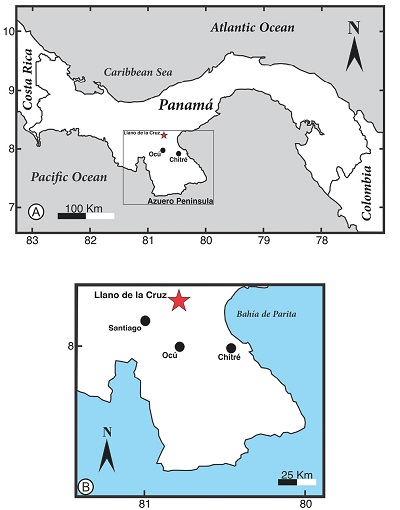
The preserved holotype fossil trunk is ~ 20 m in length and 80 cm in preserved diameter (Figure 2A to 2C). The paratype STRI 45789, was collected in Boquerones, San Francisco (latitude 08° 13’ 46.4” N; longitude 80° 51’ 45.1” W). The paratype has a size of approximately 9.3 cm in wide and 8.5 cm in length.
2.1 GEOLOGICAL CONTEXT
STRI 44038 is the largest fossilized trunk found in Panama to date. The trunk is lying within layers of sandy mudrock and sedimentary breccia, parallel to bedding. Fining upward sequences indicate fluvial environments as the main depositional system. STRI 45789, as all the others fossil woods we have collected from this area, is found as a float specimen on cattle farms covered with vegetation, as the most resistant ‘clasts’ from differential weathering. This area has been mapped as part of the Oligocene to Miocene Santiago Formation, sometimes referred to as Macaracas Formation that outcrops in the Macaracas Basin (Buchs et al., 2011). Kolarsky et al. (1995) reported samples of pollen, foraminifera, and nannofossils from the Macaracas Basin in central Azuero and concluded that they support a late Oligocene to early Miocene age, although the preservation of the specimens was poor.
The age of the Santiago Formation has not been clearly determined due to its stratigraphic complexity, lack of good outcrops, and absence of radiometric elements for dating. We are currently testing detrital zircons and studying the biostratigraphy.
2.2 ACCESSION DATA, SPECIMEN PREPARATION, AND IMAGING
Petrographic thin sections of fossil material were prepared in transverse (TS), radial longitudinal (RLS) and tangential longitudinal (TLS) sections. Sections were mounted on glass slides using EpoFix resin, ground to a thickness of ~30 μm, and coverslips were affixed with Canada balsam. Material was observed and imaged using an Olympus BX53 and digital camera SC100 with sensor CMOS of 10.5 Mpix and a Zeiss AXIO Zoom V16, photographed with an AxioCam MRc5 camera.
The fossil woods were compared with the available images of modern and fossil woods in the Inside Wood Database (IWD; insidewood.lib.ncsu.edu; Wheeler, 2011) and literature (e.g., Terrazas, 1994, 1999; León, 2003, 2014; Woodcock et al., 2017).
2.3. IAWA FEATURE DESCRIPTION AND CODING
We described the fossil wood specimens following the International Association of Wood Anatomists (IAWA) List of Features for Hardwood Identification (IAWA Committee, 1989). For quantitative data of vessel frequency, ray density, and vessel grouping, we made measurements in 10 different fields of 1 mm2 of area. For other quantitative features, we obtained a minimum of 25 measurements (mean vessel diameter, intervessel pit diameter, vessel-ray parenchyma pit diameter, vessel element length, and ray height). In the descriptions, we give a list of the IAWA character code numbers. We use the symbol ‘?’ to indicate that there is uncertainty as to whether the feature is present or absent and “v” to indicate that the feature is variable in occurrence.
3. Results
3.1. SYSTEMATIC PALEOBOTANY
Order — Sapindales Dumortier
Family — Anacardiaceae Lindley
Genus — Llanodelacruzoxylon Rodríguez-Reyes, Estrada-Ruiz et Gasson, gen. nov.
Species — Llanodelacruzoxylon sandovalii Rodríguez-Reyes, Estrada-Ruiz et Gasson, sp. nov. (Figures 2 to 4).
|
|
|
Figure 2. The “big tree” and its original position in the field. A, Preserved length of the “big tree” (arrows). B, Logs split from the original preserved total tree length. Follow arrows to see continuity of the fossil extent. C, Preservation of the external part of the fossil wood. |
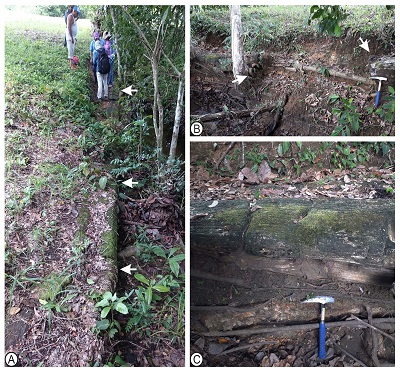
Diagnosis: Growth rings are indistinct; wood is diffuse porous; vessels are solitary combined with a few short radial multiples; perforation plates simple; intervessel pitting alternate; polygonal and medium to large; vessel-ray parenchyma pits mainly circular with reduced borders, axial parenchyma apotracheal diffuse, scanty paratracheal to vasicentric, and slightly aliform, rays heterocellular, mostly uniseriate and very rarely biseriate, non septate fibers, thin to thick walled, large solitary rhomboidal crystals very abundant in body and upright ray cells.
Species diagnosis: As for the genus.
Etymology: The generic name refers to the Llano de la Cruz locality, where the holotype was collected. The specific epithet is in recognition of Mr. Carlos Sandoval, who provided samples of the large trunk for this study.
Holotype: STRI 44038 B
Paratype: STRI 45789
Repository: Center for Tropical Paleoecology and Archaeology, Smithsonian Tropical Research Institute, Panama City, Panama.
Type locality: Llano de la Cruz, Veraguas (Azuero Peninsula).
Latitude 08° 09’ 4.7” N and longitude 80° 53’ 11.2” W.
Description in IAWA feature numbers: 2p, 5p, 10a 11a, 13p, 22p, 31p, 40a, 41a, 66p, 78p, 79p, 98a, 99a, 100a, 130a, 136p, 189p.
Description: Description based on two samples.
Growth rings indistinct to absent. Wood is diffuse porous; vessels are solitary (66%) combined with a few short radial multiples (34%) of 2–3 (–5) (Figures 3A to 3D), circular to oval in outline (Figure 3D); vessel mean tangential diameter 154 (range = 96 – 205, SD = 35.8) μm (Figure 3D); 6 (range = 4 – 9, SD = 1.5) vessels per square millimeter; perforation plates are simple (Figue 3E); intervessel pits are alternate and crowded, polygonal and medium to large (mean pit diameters 8 – 12 μm) (Figure 3F); vessel-ray parenchyma pits with reduced borders, round in shape (mean pit diameters 7.5 – 12 μm) (Figure 3H); mean vessel element length is 365 (range= 203 – 504, SD = 87) μm. Axial parenchyma is apotracheal diffuse and scanty paratracheal to vasicentric (Figures 3B to 3D). Some vessels possess slightly aliform parenchyma (Figure 3C). Parenchyma strands are 6-celled (Figure 3G).
|
|
|
Figure 3. Llanodelacruzoxylon sandovalii Rodríguez-Reyes, Estrada-Ruiz et Gasson gen. et sp. nov. A-F, STRI 44038B; G-H, STRI 45789. A, Transverse section (TS). Diffuse porous wood with vessels solitary and few in radial multiples. B, (TS). Solitary vessels and diffuse axial parenchyma. C, (TS). Three vessels with vasicentric parenchyma. D, (TS). Close up of vessel with vasicentric parenchyma. E, Tangential longitudinal section (TLS). Simple perforation plate (arrow). F, (TLS). Alternate intervessel pits (arrow). G, (TLS). Showing parenchyma strands (arrows). H, Radial Longitudinal Section (RLS). Detail of the vessel-ray parenchyma pits with reduced borders, round in shape (arrow). |

Rays heterocellular, mostly uniseriate, very rarely biseriate (Figure 4A and 4B). Mean ray frequency is 19 per mm (range = 15 – 23, SD = 2.7) (Figure 4A and 4B), composed of mixed (procumbent and upright) cells throughout the ray body (Figure 4C and 4D). Non-septate fibers (Figure 4B), thin to thick walled. Solitary, non-chambered, rhomboidal crystals very abundant in body and upright ray cells in radial alignment in procumbent ray cells (Figure 4C). The crystals are large, 43 to 50 μm in length and 22 to 39 µm in width (Figures 4C to 4D).
|
|
|
Figure 4. Llanodelacruzoxylon sandovalii Rodríguez-Reyes, Estrada-Ruiz et Gasson gen. et sp. nov. Holotype STRI 44038B. A, (TLS). Rays mostly uniseriate, some biseriate. B, (TLS). Uniseriate rays with crystals. C, (RLS). Heterocellular rays, procumbent and square body cells in radial alignment. D, (RLS). Crystals in the square body cells. |
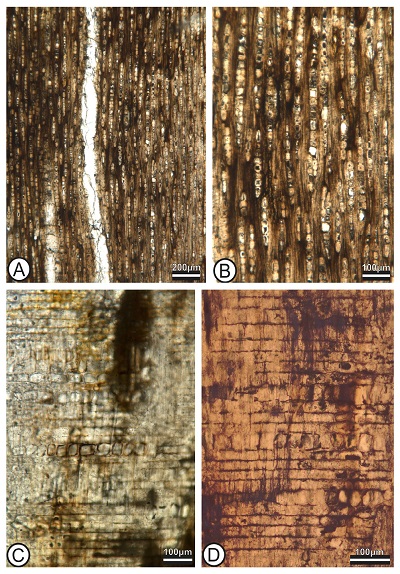
4. Discussion
4.1 INSIDE WOOD SEARCH
Burseraceae and Anacardiaceae are anatomically very similar, however Anacardiaceae can be distinguished by having more abundant axial parenchyma, more frequent septate fibers, and fewer occurrences of radial canals (Terrazas, 1994; Bell et al., 2010).
The most restrictive search we obtained in the IWD included the following characters: growth rings indistinct or absent (2p); wood diffuse porous (5p); vessels in radial multiples of 4 or more common absent (10a); vessel clusters common absent (11a); perforation plates simple (13p); intervessel pits alternate (22p); vessel-ray pits with much reduced borders (31p); vessel mean tangential diameter <50 µm absent (40a); vessel mean tangential diameter 50 -100 µm absent (41a); fibers non-septate (66p); axial paratracheal parenchyma scanty (78p), Axial paratracheal parenchyma vasicentric (79p); rays 4-10 cells wide absent (98a); rays >10-seriate absent (99a); Rays with multiseriate portion(s) as wide as uniseriate portions absent (100a); radial canals absent (130a); prismatic crystals present (136p); tree (189p). This combination of traits led to 18 results that included mostly species of Anacardiaceae and Myrtaceae. Myrtaceae can be ruled out because of exclusively solitary vessels, greater abundance of parenchyma compared to this fossil wood and vessel ray pitting with distinct borders. The other results consisted of only one or two species in families such as: Erythroxylaceae, Gentianaceae, Juglandaceae, Malvaceae, Moringaceae, Oxalidaceae, Phyllanthaceae and Rhamnaceae. Abundance of banded apotracheal parenchyma rules out the Erythroxylaceae and Malvaceae. The single result of Rhamnaceae is ruled out by its occasional distinct growth ring boundaries, vessel grouping common and more abundant parenchyma. Storied rays distinguish Moringaceae. Sarcotheca glauca (Oxalidaceae) possesses intervessel pitting large (>10µm) and are mainly shrubs, and not trees as the fossil. different from the fossil. Bridelia micrantha (Phyllanthaceae) has several features distinct from the fossil, occasional reticulate perforation plates, vessels in diagonal pattern and vessel grouping common, vessel-ray pits of different sizes in the same ray cell and septate fibres present.
After the comparison we conducted, Anacardiaceae is the family that most resembles the fossil studied herein. We detail the genus identification further in the discussion.
4.2 COMPARISON WITH ANACARDIACEAE GENERA
The mosaic of traits described from these two specimens, growth rings indistinct, wood diffuse porous, vessels solitary combined with very few short radial multiples, perforation plates simple, intervessel pitting alternate, vessel-ray parenchyma pits mainly circular with reduced borders, axial parenchyma apotracheal diffuse and scanty paratracheal to vasicentric, rays heterocellular, mostly uniseriate, very rarely biseriate rays, non septate fibers and abundance of large solitary rhomboidal crystals in procumbent and upright ray cells lead to the Anacardiaceae.
The most restrictive search in IWD included the following Anacardiaceae taxa: Faguetia falcata, Mangifera caesia, Mangifera cf. griffithii and Protorhus sp. Faguetia falcata has vessel-ray pitting in palisade and gash like, tyloses common and occasional bands of parenchyma. All these characters are absent in the fossils. The most noticeable differences between the Mangifera species from the results and LI. sandovalii, are based on wider rays and bands of parenchyma and occasionally it has a low ray density (<4 per linear mm). Protorhus possesses scalariform perforation plates and septate and non- septate fibers, whereas the fossil has simple perforation plates and non-septate fibers.
At tribe level, this fossil shares several characters with the Anacardieae (sensu Engler), such as growth rings indistinct, wood diffuse porous, vessels with no arrangement, intervascular pitting polygonal and large (>10 µm), mean vessel density (<5 per mm2), non septate fibres, paratracheal parenchyma present, but no abundant; rays uniseriate to biseriate and rays heterocellular. We stress on the intervessel pitting size that is larger in the Anacardieae compared to the other tribes (Terrazas, 1994) from the results in Inside Wood, we note that none of the taxa match the fossil. We then consulted the largest Anacardiaceae micromorphology slide collection from Instituto de Biología, Universidad Nacional Autónoma de México, under supervision of Dra. Teresa Terrazas. From that revision it was revealed that although all characters in this fossil occur in Anacardiaceae, no modern genus possesses the diagnostic features. Moreover, the pattern of vessel-ray pitting in the fossil is not common in modern Anacardiaceae. Although vessel-ray pits are all simple, circular and small (7.6 to 12.0 µm), most anacards have larger pits in palisade and gash-like pattern. We mention Mangifera as one of the genera that has a similar pattern of vessel-ray pits. Mangifera also has a good number of species with uniseriate rays and abundant crystals in procumbent and upright ray cells (Dra. Teresa Terrazas com. pers.). There are some genera that have pits smaller than 8 µm, for example Cotinus, Dobinea, Haplorhus, Lithraea, Rhus, Schinus, Toxicodendron, and Trichoscypha. These genera do not have aliform parenchyma. Trichoscypha has unilateral winged-aliform, but it presents few uniseriate rays as well as radial canals.
4.3 COMPARISON WITH OTHER FOSSIL WOODS OF ANACARDIACEAE
There are abundant records of anacardiaceous fossil woods. More than eighty wood types have been reported worldwide (Franco and Brea, 2008; Franco, 2009; Pujana, 2009; Gregory et al., 2009; Cheng et al., 2012; Mendez-Cardenas et al., 2014; Shukla and Mehrotra, 2016; Allen, 2017; Perez-Lara et al., 2017; Wheeler et al., 2017; Woodcock et al., 2017). A good number of the records come from Europe, Asia and South America (Ramírez et al., 2000).
We surveyed the Anacardiaceous fossil woods using the IWD, in order to elucidate whether LI. sandovalii resembles other previously reported fossil taxa. We summarize this survey in Table 1. We did not find any fossil wood that has all the characters in these specimens.
|
Table 1. Summary of comparison between Anacardiaceae fossil woods and Llanodelacruzoxylon sandovalii. Data were obtained from the Inside Wood Database (Wheeler et al., 2011). |
|
|
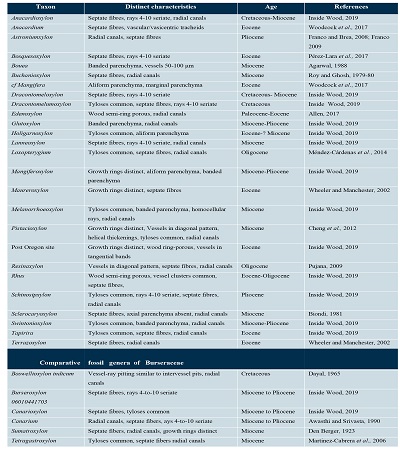
We remark that the vessel-ray pitting pattern in our fossil wood is the same as observed in Anacardium incahuasi from early Eocene of the Fossil Forest Piedra Chamana in Peru (Woodcock et al., 2017). However, A. incahuasi differs from our wood in having septate fibers, vascular vasicentric tracheids, rays 1–3 cells wide. Therefore, we erect a new fossil anacard genus and species.
4.4. PALEOECOLOGICAL AND BIOGEOGRAPHICAL REMARKS
STRI 44038B preserved trunk is ~ 20 m in length and 2.5 m wide. The dimensions suggest this “big tree” was probably ~35 m high (Figures 2A to 2C), according to Niklas’ (1995) equation. We confirmed the sandstones where it was lying were described as part of the Santiago Formation because of their properties and geological observations in the field.
Anacardiaceae and Burseraceae are good families to understand migration patterns of angiosperm families (Angiosperm Phylogeny Group,2016). Both families probably originated in Asia and diverged during the Cretaceous (Xie et al., 2014). Long distance dispersal played a key role in migration to North and South America (Weeks et al., 2014; Xie et al., 2014). Anacardiaceae displays a much wider diversity of fruit morphology and tolerance to a more diverse range of habitats than Burseraceae. This difference may help explain why Anacardiaceae has become more widespread and has successfully occupied a wider range of biomes than Burseraceae (Weeks et al., 2014).
Weeks et al. (2014) performed ancestral area reconstructions highly congruent with the fossil record. Anacardiaceae diversified during the Cretaceous and expanded into sub-Saharan Africa. From there, the route to conquer South America probably took place during the Paleogene. It is suggested that Anacardiaceae continued to steadily colonize Eurasia and temperate zones during the Miocene, when it had a widespread geographic range and likely a diversity of climatic tolerances (Weeks et al., 2014). The fossil record of Anacardiaceae was augmented especially during the Oligocene in Central America. Reports of Anacardiaceae decrease towards the Miocene.
Herrera et al. (2012) found endocarp rich assemblages in the Eocene Tonosí Formation (Azuero, Panama) that suggested a diverse rainforest. From this Formation, they identified only one Anacardiaceae (Dracontomelon) from permineralized endocarps, that is a genus only inhabiting Asia and Africa today. Based on the absence of this Anacardiaceae genus in fossil beds from the lower Miocene Cucaracha Formation, they conclude this could represent an example of local extinctions and that long time dispersal events between New and Old world forests were common in the Paleogene. Our report of LI. sandovalii from Panama, Central America adds to the understanding of the historical biogeography of Anacardiaceae and helps support the theory that Central America (including Mexico) was a divergence center of the family in the past.
Acknowledgements
We thank the Ministerio de Comercio e Industrias (MICI) for collection permits and Mr. Carlos Sandoval for allowing us to collect fossils on his private farm. We acknowledge valuable help in the field from Judith Callejas-Moreno, César Silva, Miguel Martínez and the Carlos Jaramillo´s lab in the CTPA (Center for Tropical Palaeoecology and Archaeology), Panama. We really appreciate the comments to our manuscript from an anonymous reviewer, Dr. Mariana Brea and Dr. Roberto Pujana. We are grateful to Biól. Diana K. Pérez-Lara from Instituto Politécnico Nacional for her help with the images and to Susana Guzmán at the Instituto de Biología, UNAM, for microphotography assistance. We thank Dori Lynne Contreras (University of California) for comments on an early version of the manuscript. We particularly thank Dra. Teresa Terrazas, an expert on Anacardiaceae wood anatomy for discussions on the identification of the fossils. This research has been funded by the SENACyT ITE15-023 grant to Oris J. Rodríguez-Reyes and SIP-IPN (20195100) and CONACyT (240241) grants to E.E.R.
References
Agarwal, A. 1988. Occurrence of Bouea in the Neyveli lignite deposits, India: Geophytology, 18(2), 166-168.
Allen, S.E., 2017, Reconstructing the Local Vegetation and Seasonality of the Lower Eocene Blue Rim Site of Southwestern Wyoming Using Fossil Wood: International Journal of Plant Sciences, 178(9), 689–714. https://doi.org/10.1086/694186
Angiosperm Phylogeny Group, IV. 2016, An update of the Angiosperm Phylogeny Group classification for the orders and families of flowering plants: APG IV. Botanical Journal of the Linnean Society, 181(1), 1–20. https://doi.org/10.1111/boj.12385
Awasthi, N., Srivastava, R., 1990. Some new carbonized woods from the Neogene of Kerala Coast and their bearing on palaeoclimate: Palaeobotanist 38, 285–292.
Bell, C.D., Soltis, D.E., Soltis, P.S., 2010, The age and diversification of the angiosperms revisited: American Journal of Botany 97(8), 1296–303. https://doi.org/10.3732/ajb.0900346
Biondi, E., 1981. Arganioxylon sardum n. gen., n. sp. Et Sclerocaryoxylon chiarugii n. gen., n. sp. : bois fossiles du Miocène de la Sardaigne (Italie): Review of Palaeobotany and Palynology 34, 301-320. https://doi.org/10.1016/0034-6667(81)90047-6
Buchs, D.M., Arculus, R.J., Baumgartner, P.O., Ulianov, A., 2011, Oceanic intraplate volcanoes exposed: example from seamounts accreted in Panama: Geology, 39(4), 335–338. https://doi.org/10.1130/g31703.1
Cheng, Y.-M., Mehrotra, R.C., Jin, Y.-G., Yang, W., Li, C.-S., 2012, A new species of Pistacioxylon (Anacardiaceae) from the Miocene of Yunnan, China: IAWA Journal, 33(2), 197–204. https://doi.org/10.1163/22941932-90000089
Dayal, R.,1965, Occurrence of Boswellia in the Deccan Intertrappean beds of Keria, Madhya Pradesh: Current Science 33(22), 683-84.
Den Berger, L.G. 1923. Fossiele houtsoorten uit het Tertiair van Zuid-Sumatra. Verh. Mijnb. Genoot. Ned. : Geologie enmijnbouw 7, 143–148.
Estrada-Ruiz, E., Martínez-Cabrera, H.I., Cevallos-Ferriz, S.R.S., 2010, Fossil woods from the Olmos Formation (late Campanian-early Maastrichtian), Coahuila, Mexico: American Journal of Botany, 97(7), 1179–1194.
Franco, M.J., 2009, Leños fósiles de Anacardiaceae en la Formación Ituzaingó (Plioceno), Toma Vieja, Paraná, Entre Ríos, Argentina: Ameghiniana, 46(4), 587–604.
Franco, M.J., Brea, M., 2008, Leños fósiles de la Formación Paraná (Mioceno Medio), Toma Vieja, Paraná, Entre Ríos, Argentina: registro de bosques estacionales mixtos: Ameghiniana, 45(4), 699–717.
Gentry, A.H., 1988, Changes in Plant Community Diversity and Floristic Composition on Environmental and Geographical Gradients: Annals of the Missouri Botanical Garden, 75(1), 1–34. https://doi.org/10.2307/2399464
Gregory, M., Poole, I., Wheeler, E.A., 2009, Fossil dicot wood names, an annotated list with full bibliography: IAWA Journal Supp., 6, 220 pp.
Herrera, F., Manchester, S., Jaramillo, C., 2012, Permineralized fruits from the late Eocene of Panama give clues of the composition of forests established early in the uplift of Central America: Review of Palaeobotany and Palynology, 175, 10–24. https://doi.org/10.1016/j.revpalbo.2012.02.007
IAWA Committee., 1989, List of microscopic features for hardwood identification. IAWA Bull. 10(3), 219–329. Available in: https://www.iawa-website.org/uploads/soft/Abstracts/IAWA%20list%20of%20microscopic%20features%20for%20hardwood%20identification.pdf
Jud, N.A., Dunham, J.I., 2017, Fossil woods from the Cenozoic of Panamá (Azuero Peninsula) reveal an ancient neotropical rainforest: IAWA Journal, 38(3), 366–S2. https://doi.org/10.1163/22941932-20170176
Kolarsky, R.A., Mann, P., Monechi, S., Meyerhoff, H.D., Pessagno, Jr. E.A., 1995, Stratigraphic development of southwestern Panama as determined from integration of marine seismic data and onshore geology. In: Mann, P. (Ed.). Geologic and tectonic development of the Caribbean Plate boundary in southern Central America, pp. 159–200.
Kruse, H.O., 1954. Some Eocene dicotyledonous woods from Eden Valley, Wyoming: Ohio Journal of Science 54(4), 243–268.
León, H.W.J., 2003, Estudio anatómico del xilema secundario de 17 especies de la familia Anacardiaceae en Venezuela: Acta Botánica Venezuelica, 26(1), 1–30.
León, H.W.J., 2014, Anatomía de maderas de 108 especies de Venezuela: Revista Pitteria, número especial, 1–267.
Martínez-Cabrera, H.I., Cevallos-Ferriz, S.R.S., 2004, A new species of Tapirira from Early Miocene sediments of the El Cien Formation, Baja California: IAWA Journal, 25 (1), 103–117. https://doi.org/10.1163/22941932-90000353
Martínez-Cabrera, H. I., Cevallos-Ferriz, S. R., & Poole, I. 2006, Fossil woods from early Miocene sediments of the El Cien Formation, Baja California Sur, Mexico: Review of Palaeobotany and Palynology, 138(3-4), 141-163. https://doi.org/10.1016/j.revpalbo.2006.01.001
Méndez-Cárdenas. J.P., Cevallos-Ferriz, S.R.S., Calvillo-Canadell, L., Rodríguez-Yama, G.A., Borja, A.M., Martínez-Cabrera, H.I., 2014, Loxopterygium wood in Coayuca de Andrade, Oligocene of Puebla, Mexico: Review of Palaeobotany and Palynology, 207, 38–43.
Niklas, K.J., 1995, Size-dependent allometry of tree height, diameter and trunk taper: Annals of Botany, 75(3), 217–227. https://doi.org/10.1006/anbo.1995.1015
Pennington, R.T., Lavin, M., Särkinen, T., Lewis, G.P., Klitgaard, B.B., Hughes, C.E., 2010, Contrasting plant diversification histories within the Andean biodiversity hotspot: Proceedings of the National Academy of Sciences, 107(31), 13783–13787. https://doi.org/10.1073/pnas.1001317107
Pérez-Lara, D.K., Castañeda-Posadas, C., Estrada-Ruiz, E., 2017, A new genus of Anacardiaceae from El Bosque Formation (Eocene), Chiapas, Mexico: IAWA Journal, 38(4), 543–552. https://doi.org/10.1163/22941932-20170179
Pujana, R.R., 2009, Fossil woods from the Oligocene of southwestern Patagonia (Rio Leona Formation). Atherospermataceae, Myrtaceae, Leguminosae and Anacardiaceae: Ameghiniana, 46(3), 523–535.
Ramírez, J.L., Cevallos-Ferriz, S.R.S., Silva-Pineda, A., 2000, Reconstruction of leaves of two new species of Pseudosmodingium from Oligocene strata of Puebla, México: International Journal of Plant Sciences, 161(3), 509–519. https://doi.org/10.1086/314261
Roy, S.K. , Ghosh P.K. . 1979-80,1981,Fossil woods of Anacardiaceae from the Tertiary of west Bengal, India: The Palaeobotanist 28/29, 338–352. http://14.139.63.228:8080/pbrep/handle/123456789/1105
Shukla, A., Mehrotra, R.C., 2016, Holigarna (Anacardiaceae) from the early Eocene of Western India and its palaeogeographical and palaeoclimatological significance: Journal of the Geological Society of India, 87(5), 520–524. https://doi.org/10.1007/s12594-016-0425-6
Stevens, P.F., 2001 onwards, Angiosperm Phylogeny Website, Version 9. Available in: http://www.mobot.org/MOBOT/research/APweb/
Terrazas, T., 1994, Wood anatomy of the Anacardiaceae: ecological and phylogenetic interpretation: Chapel Hill, N.C., Department of Biology, University of North Carolina, PhD thesis, 321 p.
Terrazas, T., 1999, Anatomía de la madera de Anacardiaceae con énfasis en los géneros americanos: Boletín de la Sociedad Botánica de México, 64, 103–109.
Weeks, A., Zapata, F., Pell, S.K., Daly, D.C., Mitchell, J.D., Fine, P.V.A., 2014, To move or to evolve: contrasting patterns of intercontinental connectivity and climatic niche evolution in “Terebinthaceae” (Anacardiaceae and Burseraceae): Frontiers in Genetics 5, 409. http://dx.doi.org/10.3389/fgene.2014.00409
Wheeler, E.A., 2011, Inside wood – A web resource for hardwood anatomy: IAWA Journal, 32(2), 199–211. https://doi.org/10.1163/22941932-90000051
Wheeler, E.A., Manchester, S.R., 2002, Woods of the Middle Eocene Nut Beds Flora, Clarno Formation, Oregon, USA: IAWA Journal Supplement 3, 188 pp.
Wheeler, E.A., Srivastava, R., Manchester, S.R., Baas, P., 2017, Surprisingly modern latest Cretaceous–earliest Paleocene woods of India: IAWA Journal, 38(4), 456–542. https://doi.org/10.1163/22941932-20170174
Woodcock, D.W., Meyer, H.W., Prado, Y., 2017, The Piedra Chamana fossil woods (Eocene, Peru): IAWA Journal, 38, 313–365. https://doi.org/10.1163/22941932-20170175
Xie, L., Yang, Z.Y., Wen, J., Li, D.Z., Yi, T.S., 2014, Biogeographic history of Pistacia (Anacardiaceae), emphasizing the evolution of the Madrean-Tethyan and the eastern Asian-Tethyan disjunctions: Molecular Phylogenetics and Evolution, 77, 136–146. https://doi.org/10.1016/j.ympev.2014.04.006
Manuscript received: April 26, 2019
Corrected manuscript received: July 20, 2019
Manuscript accepted: July 30, 2019
|
Boletín de la Sociedad Geológica Mexicana Volumen 72, núm. 2, A060919, 2020 |
|
Palaeoenvironmental reconstruction and sequence stratigraphy of the Lower Cretaceous deposits in the Zagros belt, SW Iran
Reconstrucción paleoambiental y estratigrafía secuencial de los depósitos del Cretácico Inferior en el cinturón de Zagros, SW Irán
Seyed Mohammad Ali Moosavizadeh1, Hamed Zand-Moghadam2, Amir Hossein Rahiminejad3,*
1 Department of Geology, Faculty of Sciences, Yazd University, University Blvd, 98195741, Safayieh , Yazd, Iran.
2 Department of Geology, Faculty of Sciences, Shahid Bahonar University of Kerman, 7616913439, Kerman, Iran.
3 Department of Ecology, Institute of Science and High Technology and Environmental Sciences, Graduate University of Advanced Technology, 7631818356, Kerman, Iran.
* Corresponding author: (A. H. Rahiminejad)
This email address is being protected from spambots. You need JavaScript enabled to view it.
How to cite this article:
Moosavizadeh, S.M.A., Zand-Moghadam, H., Rahiminejad, A.H., 2020, Palaeoenvironmental reconstruction and sequence stratigraphy of the Lower Cretaceous deposits in the Zagros belt, SW Iran: Boletín de la Sociedad Geológica Mexicana,72 (2), A060919. http://dx.doi.org/10.18268/BSGM2020v72n2a060919
Abstract
Depositional environments and sequence stratigraphy of the Lower Cretaceous deposits of the Dariyan Formation were studied in the Zagros belt, SW Iran. The Dariyan Formation was investigated in the Interior Fars and the Izeh Zone in the SE margin of the Kazhdumi intra-shelf Basin, which has not been previously studied. Based on the benthic foraminifera, the Dariyan Formation is early Aptian to early Albian in age. The studies show that the Dariyan Formation was deposited in deep open-marine, shallow open-marine, shoal, and lagoonal settings on a homoclinal ramp. Three third-order depositional sequences (Ds1, Ds2, and Ds3) and three type 2 sequence boundaries (SB2) were recognized. The depositional sequences in the Dariyan Formation comprise three transgressive systems tracts (TSTs) and two highstand systems tracts (HSTs). During sea-level rise in the earliest Aptian, the Dariyan Formation was deposited on top of the the Barremian Gadvan Formation. Deep open-marine subsidence and sea-level rise led to deposition of radiolarian-bearing facies of the Dariyan Formation during the earliest Aptian. Subsequently, HSTs resulted in deposition of orbitolinid-rich facies in the deep open-marine setting (late early Aptian). Planktic foraminifera-bearing deposits were deposited during the subsequent sea-level rise (early late Aptian). Sea-level fall subsequently resulted in progradation of platform top (shallow open-marine, shoal, and lagoon) deposits into the deep open-marine setting (latest Aptian). Finally, sea-level rise resulted in deposition of the Albian Kazhdumi Formation on the Dariyan Formation during the early Albian. The sea-level changes recorded for the Dariyan Formation are consistent with Early Cretaceous sea-level patterns recognized elsewhere on the Arabian Plate.
Keywords: Facies, sequence stratigraphy, Dariyan Formation, Aptian–Albian, Zagros fold-thrust belt.
Resumen
Este estudio representa los aspectos paleoambientales y la estratigrafía secuencial de la Formación Dariyan del Cretácico Inferior en el cinturón de Zagros, SW Irán. Se midió la formación en el Interior de Fars y la Zona de Izeh en el margen SE de la cuenca intra-plataforma de Kazhdumi la cual no se había estudiado previamente. Basado en los foraminíferos bentónicos identificados, la Formación Dariyan tiene una edad de Aptiano temprano-Albiano temprano. Los estudios muestran que la Formación Dariyan se depositó en entornos de mar abierto profundo, mar abierto poco profundo, barra de arena y laguna en una rampa homoclinal. Se determinaron tres secuencias deposicionales de tercer orden (Ds1, Ds2 y Ds3) y tres límites de secuencia tipo 2 (SB2) en la formación. Las secuencias deposicionales en la Formación Dariyan comprenden tres tramos de sistemas transgresivos (TST) y dos tramos de soporte vertical (HST). Durante el aumento del nivel del mar en el Aptiano más temprano, la Formación Dariyan se depositó en la Formación Barremian Gadvan. La subsidencia en mar abierto profundo y el aumento del nivel del mar condujeron a la formación de facies portadoras de radiolarios en la Formación Dariyan durante el Aptiano más temprano. Posteriormente, el HST resultó en la deposición de facies ricas en orbitolinidos en el entorno marino abierto profundo (Aptiano temprano tardío). Se asentaron depósitos de foraminíferos pláncticos durante el posterior aumento del nivel del mar (Aptiano tardío temprano). Posteriormente, la caída del nivel del mar resultó en la progradación de depósitos (marinos abiertos poco profundos, de barrera de arena y de laguna) en la plataforma superior en el entorno marino abierto profundo (Aptiano tardío). Finalmente, el aumento del nivel del mar resultó en la depositación de la Formación Albiana Kazhdumi en la Formación Dariyan en el Albiano temprano. Los cambios en el nivel del mar registrados para la Formación Dariyan en este estudio son consistentes con los cambios en el nivel del mar del Cretácico temprano en la Placa de Arabia.
Palabras clave: Facies, estratigrafía secuencial, Formación Dariyan, Aptiano–Albiano, Cinturón de pliegues y cabalgaduras Zagros.
- Introduction
The Zagros fold-thrust belt in southwestern Iran is characterized by sedimentary deposits ranging in age from the late Precambrian (Hormoz Salt Formation) to the present (James and Wynd, 1965; Setudehnia, 1978; Berberian and King, 1981).
The Lower Cretaceous Dariyan Formation in the Zagros belt represents one of the most important carbonate reservoirs in the northeastern margin of the Arabian Plate and the Middle East (Persian Gulf, formerly southwest of the Neo-Tethys Ocean; Figure 1) (Al-Husseini and Matthews, 2010; Rahmani et al., 2010; Mansouri-Daneshvar et al., 2015). Following sea-level rise, the Dariyan Formation was deposited during the Aptian–Albian (Sharland et al., 2001; Ziegler, 2001; Alavi, 2004, 2007; Schroeder et al., 2010) in the uppermost part of the Upper Jurassic to the Lower Cretaceous Khami Group (James and Wynd, 1965; Mansouri-Daneshvar et al., 2015), between the older Gadvan and the younger Kazhdumi shale-dominated formations (Sharland et al., 2001; Van Buchem et al., 2010) (Figure 2).
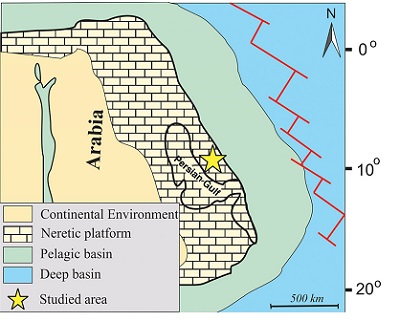 |
|
Figure 1. Location of the Arabian plate during the Aptian (after Huck et al., 2010, 2011). The studied area is located in the northeastern margin of the Arabian Plate and the Middle East and was formerly situatd in southwest of the Neo-Tethys Ocean (Al-Husseini and Matthews, 2010; Rahmani et al., 2010; Mansouri-Daneshvar et al., 2015). The present day locations of the Persian Gulf Region and the studied area are shown on the map. |
The Dariyan Formation corresponds to foraminiferal biozones 16, 17, and 18 of Wynd (1965). In this paper, our focus is on the south-eastern margin of the Kazhdumi Intra-shelf Basin in the Zagros belt. Previous studies of this part of Iran are scarce to absent.
The aim of this study was to investigate the depositional model and the sequence stratigraphic architecture of the Dariyan Formation in the Zagros belt. By doing so, this paper contributes to a better understanding of relative sea-level changes during the Early Cretaceous and shed light on the deposition of Lower Cretaceous carbonates in the Zagros belt.
Results presented herein are relevant from a local and regional Early Cretaceous perspective and, more generally, contribute to palaeogeographical reconstructions of the Zagros belt and petroleum exploration in this region.
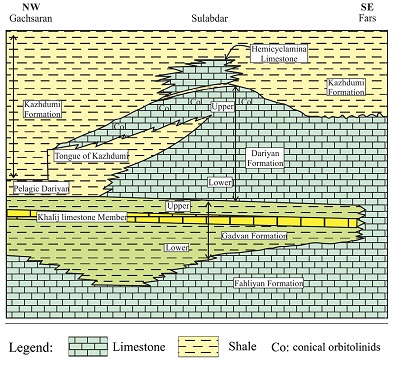 |
|
Figure 2. Generalized stratigraphic section of the Barremian–Albian formations in the Zagros belt. The Dariyan Formation was deposited between the Gadvan and the Kazhdumi formations (simplified from Motiei, 1993). |
- Geological setting and location of the studied area
The studied area lies in the structural zones of Izeh (the Izeh Zone) and the Interior Fars Province in the Zagros fold-thrust belt, southwestern Iran (Figure 3). The Zagros fold-thrust belt is about 2000 km long and resulted from the Arabia–Eurasian collision (Beydoun et al., 1992; Alavi, 2004; Fakhari et al., 2008). This belt is a part of the Alpine–Himalayan orogenic belt and extends in a NW–SE trend from the East Anatolian fault in eastern Turkey to the south of Iran and into Oman (Alavi, 2004). The evolutionary and depositional trends of the sedimentary successions in the Zagros belt record the geology and palaeoceangraphy of the Cretaceous in the northeastern margin of the Arabian Plate (Sharland et al., 2001; Ziegler, 2001; Alavi, 2004, 2007).
The Zagros belt in the northeastern margin of the Gondwana Super continent migrated along a ‘C’-shaped pathway between the latest Precambrian and the Present (Heydari, 2008). During this time, a 7 to 12 km-thick succession of detrital, evaporitic, and carbonate rocks was deposited in what today form the Zagros Mountains (Heydari, 2008).
The deposition of the Aptian–Albian Dariyan Formation in the Zagros belt was synchronous with the development of extensive Tethyan carbonate platforms (Masse, 1993; Ziegler, 2001; Skelton et al., 2003). The Dariyan Formation was originally referred to as ‘Orbitolina limestone’ (James and Wynd, 1965) and generally consists of shallow-water limestones rich in orbitolinids and rudists (Van Buchem et al., 2010). The formation is locally divided into a lower and an upper unit separated by the informal ‘Kazhdumi Tongue’ unit (Sedaghat, 1982) consisting of planktic foraminifera-bearing shales and marls (Van Buchem et al., 2010). The Dariyan Formation conformably overlies the shale deposits of the Gadvan Formation with an isochronous boundary (James and Wynd, 1965; Schroeder et al., 2010; Van Buchem et al., 2010) and is in turn conformably overlain by the Kazhdumi Formation with a diachronous contact (Schroeder et al., 2010) (James and Wynd, 1965; Motiei, 1993; Van Buchem et al., 2010). During the Early Cretaceous, regional depocenters (intra-shelf basins) developed on the Arabian passive margin as a result of fault activation and/or salt diapir movements (Sharland et al., 2001; Van Buchem et al., 2010). The Kazhdumi intra-shelf Basin, one of these depocenters, resulted from the Kazerun and Hendijan strike-slip activities (Sharland et al., 2001; Van Buchem et al., 2010).
The studied area is located in the southeastern margin of the Kazhdumi intra-shelf Basin (Sharland et al., 2001). There, the Dariyan Formation was studied in three stratigraphic sections (Paskahak, Seydan, and Sangsiah; Figures 3 to 6). According to the structural subdivisions of the Zagros fold-thrust belt (Alavi, 2004, 2007), the Paskahak section (30° 17’ 08”N, 51°30’ 12”E) is located in the Izeh Zone in about 17 km of west of the Kazerun fault. The Sangsiah (30° 05’ 37”N, 53°08’ 23”E) and Seydan (30° 05’ 19”N, 52°56’ 43”E) sections are situated in the Interior Fars Province, east of the fault (Figure 3).
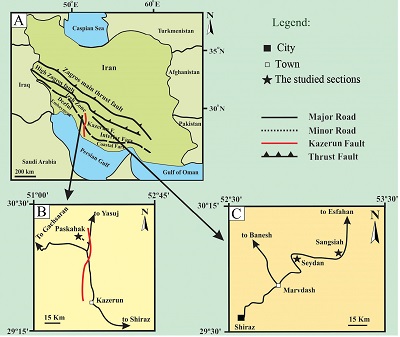 |
| Figure 3. Localities of the studied sections of the Dariyan Formation in the Zagros fold-thrust belt, southwest Iran (modified from Habibi, 2016). The Sangsiah and Seydan sections are situated in the Interior Fars, whereas the Paskahak section is located in the Izeh Zone, west of the Kazerun fault. The Seydan section (30°05′19″N, 52°56′43″E) was measured 65 km to the northeast of the city of Shiraz. The Sangsiah section (30°05′37″N, 53°08′23″E) was measured 80 km northeast to the city of Shiraz and 24 km from the Seydan section. The Paskahak section (30°17′08″N, 51°30′12″E) was measured 76 km northwest to the town of Kazerun. |
- Materials and methods
The stratigraphic sections of the Dariyan Formation (Figures 3 to 6) were selected based on the geological maps of Fahliyan (McQuillin, 1974), Sivand (Yousefi and Kargar, 1999), and Saadat-Shahr (Kargar, 2002). Note that these sections allowed us to study the platform top and deep open-marine facies of the Dariyan Formation. A total of 395 rock samples (limestone, marl, and shale) were collected and classified based on the Grabau (1904) classification.
Uncovered thin sections were prepared for petrographic analyses. Facies types and benthic foraminifera were identified based on field observations and microscopic analyses of the thin sections. The thin-sections were analyzed with an Olympus polarizing microscope. The classification of the facies is according to Dunham (1962) and Embry and Klovan (1971). In order to distinguish calcite and dolomite, thin sections were stained following the approach of Dickson (1966). Based on this method, a solution was obtained by mixing 0.2 g of Alizarin Red S and 100 mL of hydrochloric acid (1.5%). The uncovered thin sections were put in the solution for 20s. The calcite grains turned red, whereas the dolomite grains remained colourless.
Twenty-seven samples of the shales and marls were washed and sieved. Planktic foraminifera were separated using a binocular microscope and fossils documented under a scanning electron microscope. Standard facies models proposed by Burchette and Wright (1992) and Flügel (2010) were used for the depositional interpretation. Sequence-stratigraphy analyses were based on Catuneanu et al. (2009, 2011).
- Results
The stratigraphic details of the Dariyan Formation in the three sections are shown in Figures 4 to 7.
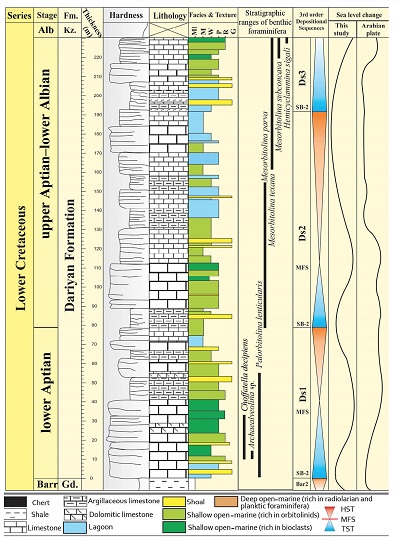 |
| Figure 4. The stratigraphic column of the Dariyan Formation (230 m thick) in the Sangsiah section. Kz.: Kazhdumi Formation. Gd.: Gadvan Formation. Ml: marl. M: mudstone. W: wackestone. P: packstone. R: rudstone. G: grainstone. Ds: depositional sequence. SB-2: type 2 sequence boundary. MFS: maximum flooding surface. HST: highstand systems tract. TST: transgressive systems tract. Barr: Barremian.Alb: Albian. Fm: Formation. The sea-level curve of the Arabian Plate is based on Van Buchem et al. (2010). |
4.1. LITHOSTRATIGRAPHY
The Dariyan Formation conformably overlies the Barremian Gadvan Formation and is in turn conformably overlain by the Albian Kazhdumi Formation in all studied sections (Figure 4 to 6).
In the Sangsiah section (Figures 4 and 7A to 7D), the 230m thick Dariyan Formation is divided into three lithostratigraphic units: (i) The lower unit (65 m thick) consists of grey to light grey, thick-bedded limestones. Orbitolinids are scattered on the rock surface of the limestones. (ii) The middle unit (49 m thick) mainly comprises thin- to medium-bedded argillaceous limestones (containing discoidal orbitolinids) and intercalations of orbitolinid-bearing grey shales. (iii) The upper unit (116 m thick) consists of light-grey ooidal limestones. In the Sangsiah section, five thickening-upward cycles are present in the form of medium- to thickly-bedded limestones in the Dariyan Formation in the Sangsiah section (Figure 7B). Cross laminationated light-grey limestones and cross-bedding structures are typical for this section (Figure 7C and 7D).
Based on the presence of alternations of marl and shale in an interval (the Kazhdumi Tongue) in the middle part of the Dariyan Formation (Figures 5 and 7E to 7I), in the Seydan section, this formation is divided into a lower unit (lower Dariyan), the Kazhdumi Tongue, and an upper unit (upper Dariyan). The lower unit, 37 m in thickness, is mainly composed of limestones, argillaceous limestones, and intercalations of shales and brown to black cherty bands. Shallowing-upward parasequences with flooding surfaces are present in the lower unit in the Seydan section (Figure 7G). Grain-size decreases upsection in a regionally important Exogyra marker shell bed (Figure 7I) in the lower unit in the Seydan and Paskahak sections (Figure 7H). Individual shells are commonly well preserved and only a limited number of fragmented shells are found. Note, intraclasts are absent and there is no clastic contact or boundary in the basal boundary of the bed.
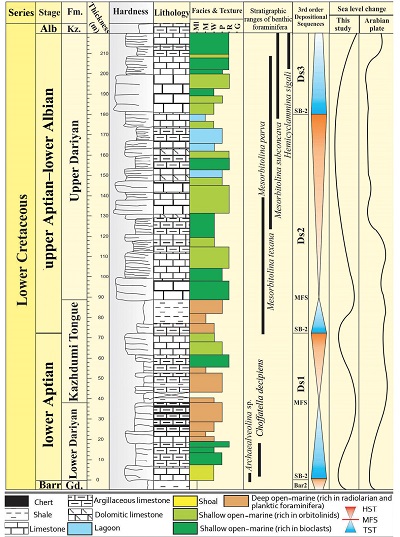 |
| Figure 5. The stratigraphic column of the Dariyan Formation (220 m thick) in the Seydan section. Gd: Gadvan Formation. Kz: Kazhdumi Formation. Ml: marl (marls and shales occur in the ‘Kazhdumi Tongue’ and the upper part of the lower unit of the Dariyan Formation). M: mudstone. W: wackestone. P: packstone. R: rudstone. G: grainstone. Ds: depositional sequence. SB-2: type 2 sequence boundary. MFS: maximum flooding surface. HST: highstand systems tract. TST: transgressive systems tract. Barr: Barremian.Alb: Albian. Fm: Formation. The sea-level curve of the Arabian Plate is based on Van Buchem et al. (2010). |
In the uppermost part of the lower unit of the Dariyan Formation in the Seydan and Paskahak sections, ammonite external casts and horizontal laminations are present. The Kazhdumi Tongue (50 m thick) consists of alternations of grey shales and marls and few intercalations of argillaceous limestones. The shale deposits are rich in planktic foraminifera. The upper unit of the Dariyan Formation (Seydan section), is 133 m thick, comprises grey and dark-grey, medium- to thickly-bedded calcarenite and calcirudite limestones with conical and discoidal orbitolinids, bivalves (mainly rudists), and gastropods. In the Seydan section, bioturbation is a common feature in the uppermost parts of the upper Dariyan unit. (Figure 7F).
In the Paskahak section, the Dariyan Formation (Figures 6 and 7H to 7L) is divided into a lower unit (lower Dariyan), the Kazhdumi Tongue, and an upper unit (upper Dariyan). The lower unit (32 m thick), consists of thickly-bedded limestones with bivalve shells (mainly rudists), grey thin-bedded argillaceous limestones (with planktic foraminifera and ammonites) and intercalations of marls and shales. The Kazhdumi Tongue (68 m thick) is built by an alternation of marls and shales (in the Seydan section, shales are more abundant than in the Kazhdumi Tongue). The upper unit is 100 m thick and mainly comprises medium- to thickly-bedded, orbitolinid-bearing limestones. In the Paskahak section, limonitic bioturbations are present in the basal part of the lower unit of the Dariyan Formation (Figure 7K). Continuous and discontinuous silicified intercalations occur in the lower unit of the formation (Figure 7L).
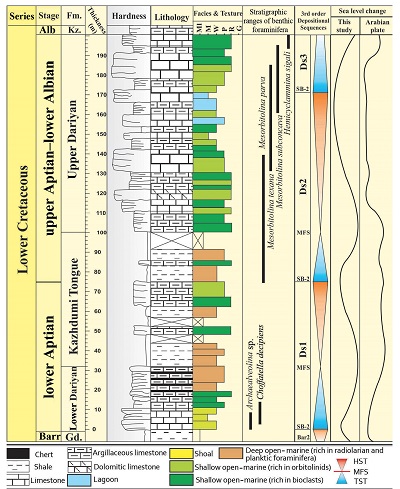 |
|
Figure 6. The stratigraphic column of the Dariyan Formation (200 m thick) in the Paskahak section. Gd: Gadvan Formation. Kz: Kazhdumi Formation. Ml: marl (marls and shales occur in the ‘Kazhdumi Tongue’ and the upper part of the lower unit of the Dariyan Formation). M: mudstone. W: wackestone. P: packstone. R: rudstone. G: grainstone. Ds: depositional sequence. SB-2: type 2 sequence boundary. MFS: maximum flooding surface. HST: highstand systems tract. TST: transgressive systems tract. Barr: Barremian. Alb: Albian. Fm: Formation. The sea-level curve of the Arabian Plate is based on Van Buchem et al. (2010). |
4.2. BIOSTRATIGRAPHY
The biostratigraphic details of the Dariyan Formation as shown in the studied sections are documented in Figures 4 to 6. The stratigraphic range of the identified benthic foraminifera suggests that the Dariyan Formation is early Aptian to early Albian in age (Boudagher-Fadel, 2008; Schroeder et al., 2010; Figures 4 to 6 and 8). The identified foraminifera (Figure 8) are: Choffatella decipiens, Archaealveolina sp., Palorbitolina lenticularis, Mesorbitolina parva, Mesorbitolina texana, Mesorbitolina subconcava, and Hemicyclammina sigali.
4.3. FACIES
Fifteen facies types were identified in the studied sections (Figures 4 to 6 and 9). These are described below:
4.3.1 F1: SHALE
Facies F1 consists of grey, green, and black shales. This facies is typical of the Kazhdumi Tongue and the upper part of the lower unit of the Dariyan Formation in the Seydan and Paskahak sections. The shales mainly contain planktic foraminifera (Figure 9A) and laterally grade into marls and argillaceous limestones.
4.3.2 F2: MARL
Facies F2 is typified by grey to dark-grey marls. Biota include planktic foraminifera and radiolarians. Facies F2 is present in the Kazhdumi Tongue and the upper beds of the lower Dariyan unit in the Seydan and Paskahak sections (Figures 5 and 6).
4.3.3 F3: RADIOLARIAN WACKESTONE/PACKSTONE
Radiolarians are the dominant biota in facies F3 (Figure 9B and 9C). Radiolarian tests have a mean dimension of 0.03 mm and are commonly calcified. Other biota include planktic foraminifera, sponge spicules, and bioclasts such as thin bivalve shells in the form of filaments (Flügel, 2010). Moreover, facies F3 is rich in organic materials (Figure 9B). This facies is typical for the Seydan and Paskahak sections. The radiolarian wackestone/packstone facies crops out as limestones and thin-bedded argillaceous limestones (10–50 cm thick). Horizontal laminations and ammonite external casts are common in the limestones. Facies F3 grades upsection into black cherts.
4.3.4 F4: PLANKTIC FORAMINIFERA WACKESTONE/PACKSTONE
The main biota in facies F4 (Figure 9D) include planktic foraminifera hosted in a micritic matrix. Foraminifera tests range in size from 0.1 to 0.25 mm. Other biota, such as sponge spicules and radiolarians, are present but volumetrically less singificant. Abundant organic material is probably the reason for the dark weathering color of facies F4, and particularly so in the Paskahak section. Locally, red-brown oil staining is observed.
4.3.5 F5: BIOCLASTIC WACKESTONE/PACKSTONE
Facies F5 yields a diverse bioclastic assemblage (30–50%) of bivalves (rudists and oysters), brachiopods, gastropods, and echinoid spines (Figure 9E) all embedded in a micritic matrix. Skeletal remains range in size from several microns to 5 mm. Sparse discoidal orbitolinids are present but are volumetrically subordinate. Peloids (10–12%) are rare.
4.3.6 F6: BIOCLASTIC RUDSTONE
Bivalve fragements and shells (rudist debris and oysters), gastropods, and crinoid ossicles are the dominant biota (about 3 to 4 mm in diameter) of facies F6 (Figure 9F). The abundance of skeletal grains larger than 2 mm is approximately 15 to 20%. Bivalve remains (mainly rudists) that range in size from 10 to 15 cm occur in this facies. In the lower and middle parts of the lower unit of the Dariyan Formation, facies F6 crops out as grey and dark-grey, medium-bedded limestones. Accumulation of the remains of bivalves and crinoid ossciles (about 4 cm in size) locally form shell beds in the lower unit of the Dariyan Formation in the Seydan and Paskahak sections.
4.3.7 F7: DISCOIDAL ORBITOLINID RUDSTONE
Facies F7 (Figure 9G) is dominated by large discoidal orbitolinids (~3–4 mm in diameter). Subordinate biota include benthic foraminifera (such as textularids) and fragments of bivalves (rudists and oysters) and gastropods. Peloids are present in facies F7.
4.3.8 F8: BIOCLASTIC GRAINSTONE
Facies F8 is a cement-supported grainstone with abundant skeletal grains.These include: fragments of bivalves (mainly rudists), echinoids (<1 mm in size), gastropods, and benthic foraminifera such as orbitolinids (Figure 9H). The size of the fragments of bivalves and gastropod shells reaches up to 4 mm. Conical orbitolinids, with a relative abundance of 15%, are also present in this grain-supported facies.
4.3.9 F9: OOID GRAINSTONE
Concentric ooids (0.7–1.2 mm) embedded in a sparry cement are the dominant (ca. 45%) grains in facies F9 (Figure 9I). The nuclei of ooids include peloids, fragments of echinoid spines, bivalves (mainly rudists), and benthic foraminifera such as miliolids. Ooids with nuclei comprising bioclasts are larger in size (~1.5 mm) and are elongated or ellipsoidal in shape. Peloids (up to 10%), green algae (~5%) (yellow arrow in Figure 9I), and benthic foraminifera such as textularids (~5–8%), represent subordinate grains. Facies F9 occurs in yellow, thin- and cross-bedded limestones.
4.3.10 F10: PELOIDAL ORBITOLINID GRAINSTONE
Facies F10 (Figure 9J) is dominated by conical orbitolinids (~1.5 mm in size; 40%) embedded in a sparry cement. Peloidal grains (~15–20%; 0.2 mm in diameter) are well sorted and moderately rounded. Skeletal grains, such as benthic foraminifera (miliolids and textularids) (~ 8%), are less common. Facies F10 crops out in the form of grey, thinly-bedded limestones with cross-laminations.
4.3.11 F11: PELOIDAL GRAINSTONE
Peloids (~35%) in a sparry cement are the most common grains in facies F11 (Figure 9K). These grains range in size from 0.2 to 0.35 mm and are not well rounded. They are considered as lithic type peloids. Benthic foraminifera (~ 15%), such as miliolids, textularids, and Nezazzata, are the subordinate grains (~0.5 mm in size). Facies F11 is less common in the studied sections and was only identified in a few beds in the Sangsiah section.
4.3.12 F12: ORBITOLINID PACKSTONE
Facies F12 is typified by its grain-supported texture and the predominance of orbitolinids. Orbitolinids (Figure 9L) are mostly (~40%) conical (with a length/height ratio of less than 1.5). They range in size from about 1.5 to 2 mm. Subordinate grains (~10–15%) include other benthic foraminifera, such as miliolids and textularids as well as peloids. Facies F12 is one of the major carbonate facies of the Dariyan Formation and is present in the three studied stratigraphic sections.
4.3.13 F13: PELOIDAL FORAMINIFERA WACKESTONE/PACKSTONE
The dominant grains in facies F13 (Figure 9M) include benthic foraminifera (miliolids and textularids) (~25%) and peloids (~15%). The grains are about 0.5 mm in size. Fragments of green algae are also present. Facies F13 is present in all studied sections. In outcrop, facies F 13 appears as grey to dark-grey, medium-bedded limestones.
4.3.14 F14: PELOIDAL GREEN ALGAE WACKESTONE/PACKSTONE
Facies F14 is dominated by green algae (~20%) and peloids (~15%) (Figure 9N). Fragments and well–preserved specimens of Lithocodium aggregatum (yellow arrow in Figure 9N) are present. Facies F14 is typical in the Sangsiah section.
4.3.15 F15: MILIOLID MUDSTONE
Facies F15 predominantly consists of lime mud and yields a limited number of benthic foraminifera, such as miliolids (~ 8%), and rare fine-grained bioclasts such as bivalves and gastropods (Figure 9O). Facies F15 is present in all studied sections.This facies crops out as grey and dark-grey, medium-and thick-bedded limestones.
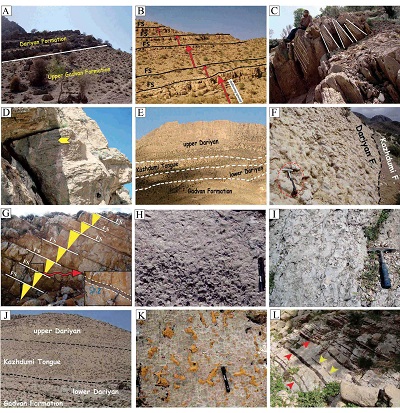 |
| Figure 7. Outcrop images and details of the Dariyan Formation in the studied sections. (A) The lower or basal boundary of the formation in the Sangsiah section. (B) The five thickening upward cycles of the medium to thickly-bedded limestones in the Sangsiah section. (C) Cross-bedding in the Sangsiah section. (D) Cross lamination in light grey limestones in the Sangsiah section. (E) General view of Dariyan Formation in the Seydan section. (F) The top surface of the upper unit of the Dariyan Formation with largely distributed bioturbations in the Seydan section. (G) Shallowing-upward parasequences with flooding surface (FS) in the lower unit of the Dariyan Formation in the Seydan section. Red arrow and dotted lines: flooding surface. (H) Grain-size decreases upsection in an Exogyra marker shell bed in the lower unit of the Dariyan Formation (in the Seydan and Paskahak sections). (I) Exogyra marker shell bed in the lower unit in the Seydan and Paskahak sections. (J) General view of the Dariyan Formation in the Paskahak section. (K) Limonitic bioturbations in the base of the lower unit of the Dariyan Formation in the Paskahak section. (L) Continuous (red arrows) and discontinuous (yellow arrows) silicified intercalations in the lower unit of the Dariyan Formation in the Paskahak section. |
- Interpretation
5.1. DEPOSITIONAL ENVIRONMENTS
Based on the standard facies models (e.g., Wilson, 1975; Read, 1985; Burchette and Wright, 1992; Flügel, 2010) and the identified facies in the Dariyan Formation, four depositional settings including deep open-marine, shallow open-marine, shoal, and lagoon were established (Figures 4 to 6, 9 and 10).
5.1.1 DEEP OPEN-MARINE SETTING
The occurrence of shales (facies F1) and marls (facies F2) and the horizontal laminations and muddy matrix reflect low-energy conditions (Bover-Arnal et al., 2009; Flügel, 2010). Additionally, the presence of biotic components, such as radiolarians and planktic foraminifera, and the absence of benthic and euphotic fauna in facies F1 though F4, indicate that deposition occurred under relatively low-energy conditions in a deep open-marine setting (Cosovic et al., 2004; Nichols, 2009; Bassi and Nebelsick, 2010; Payros et al., 2010). Moreover, high amounts of organic materials in the matrix (e.g., in the Paskahak section) might indicate oxygen depletion or deficiency in basinal water masses (Michalík et al., 2008; Stein et al., 2012).
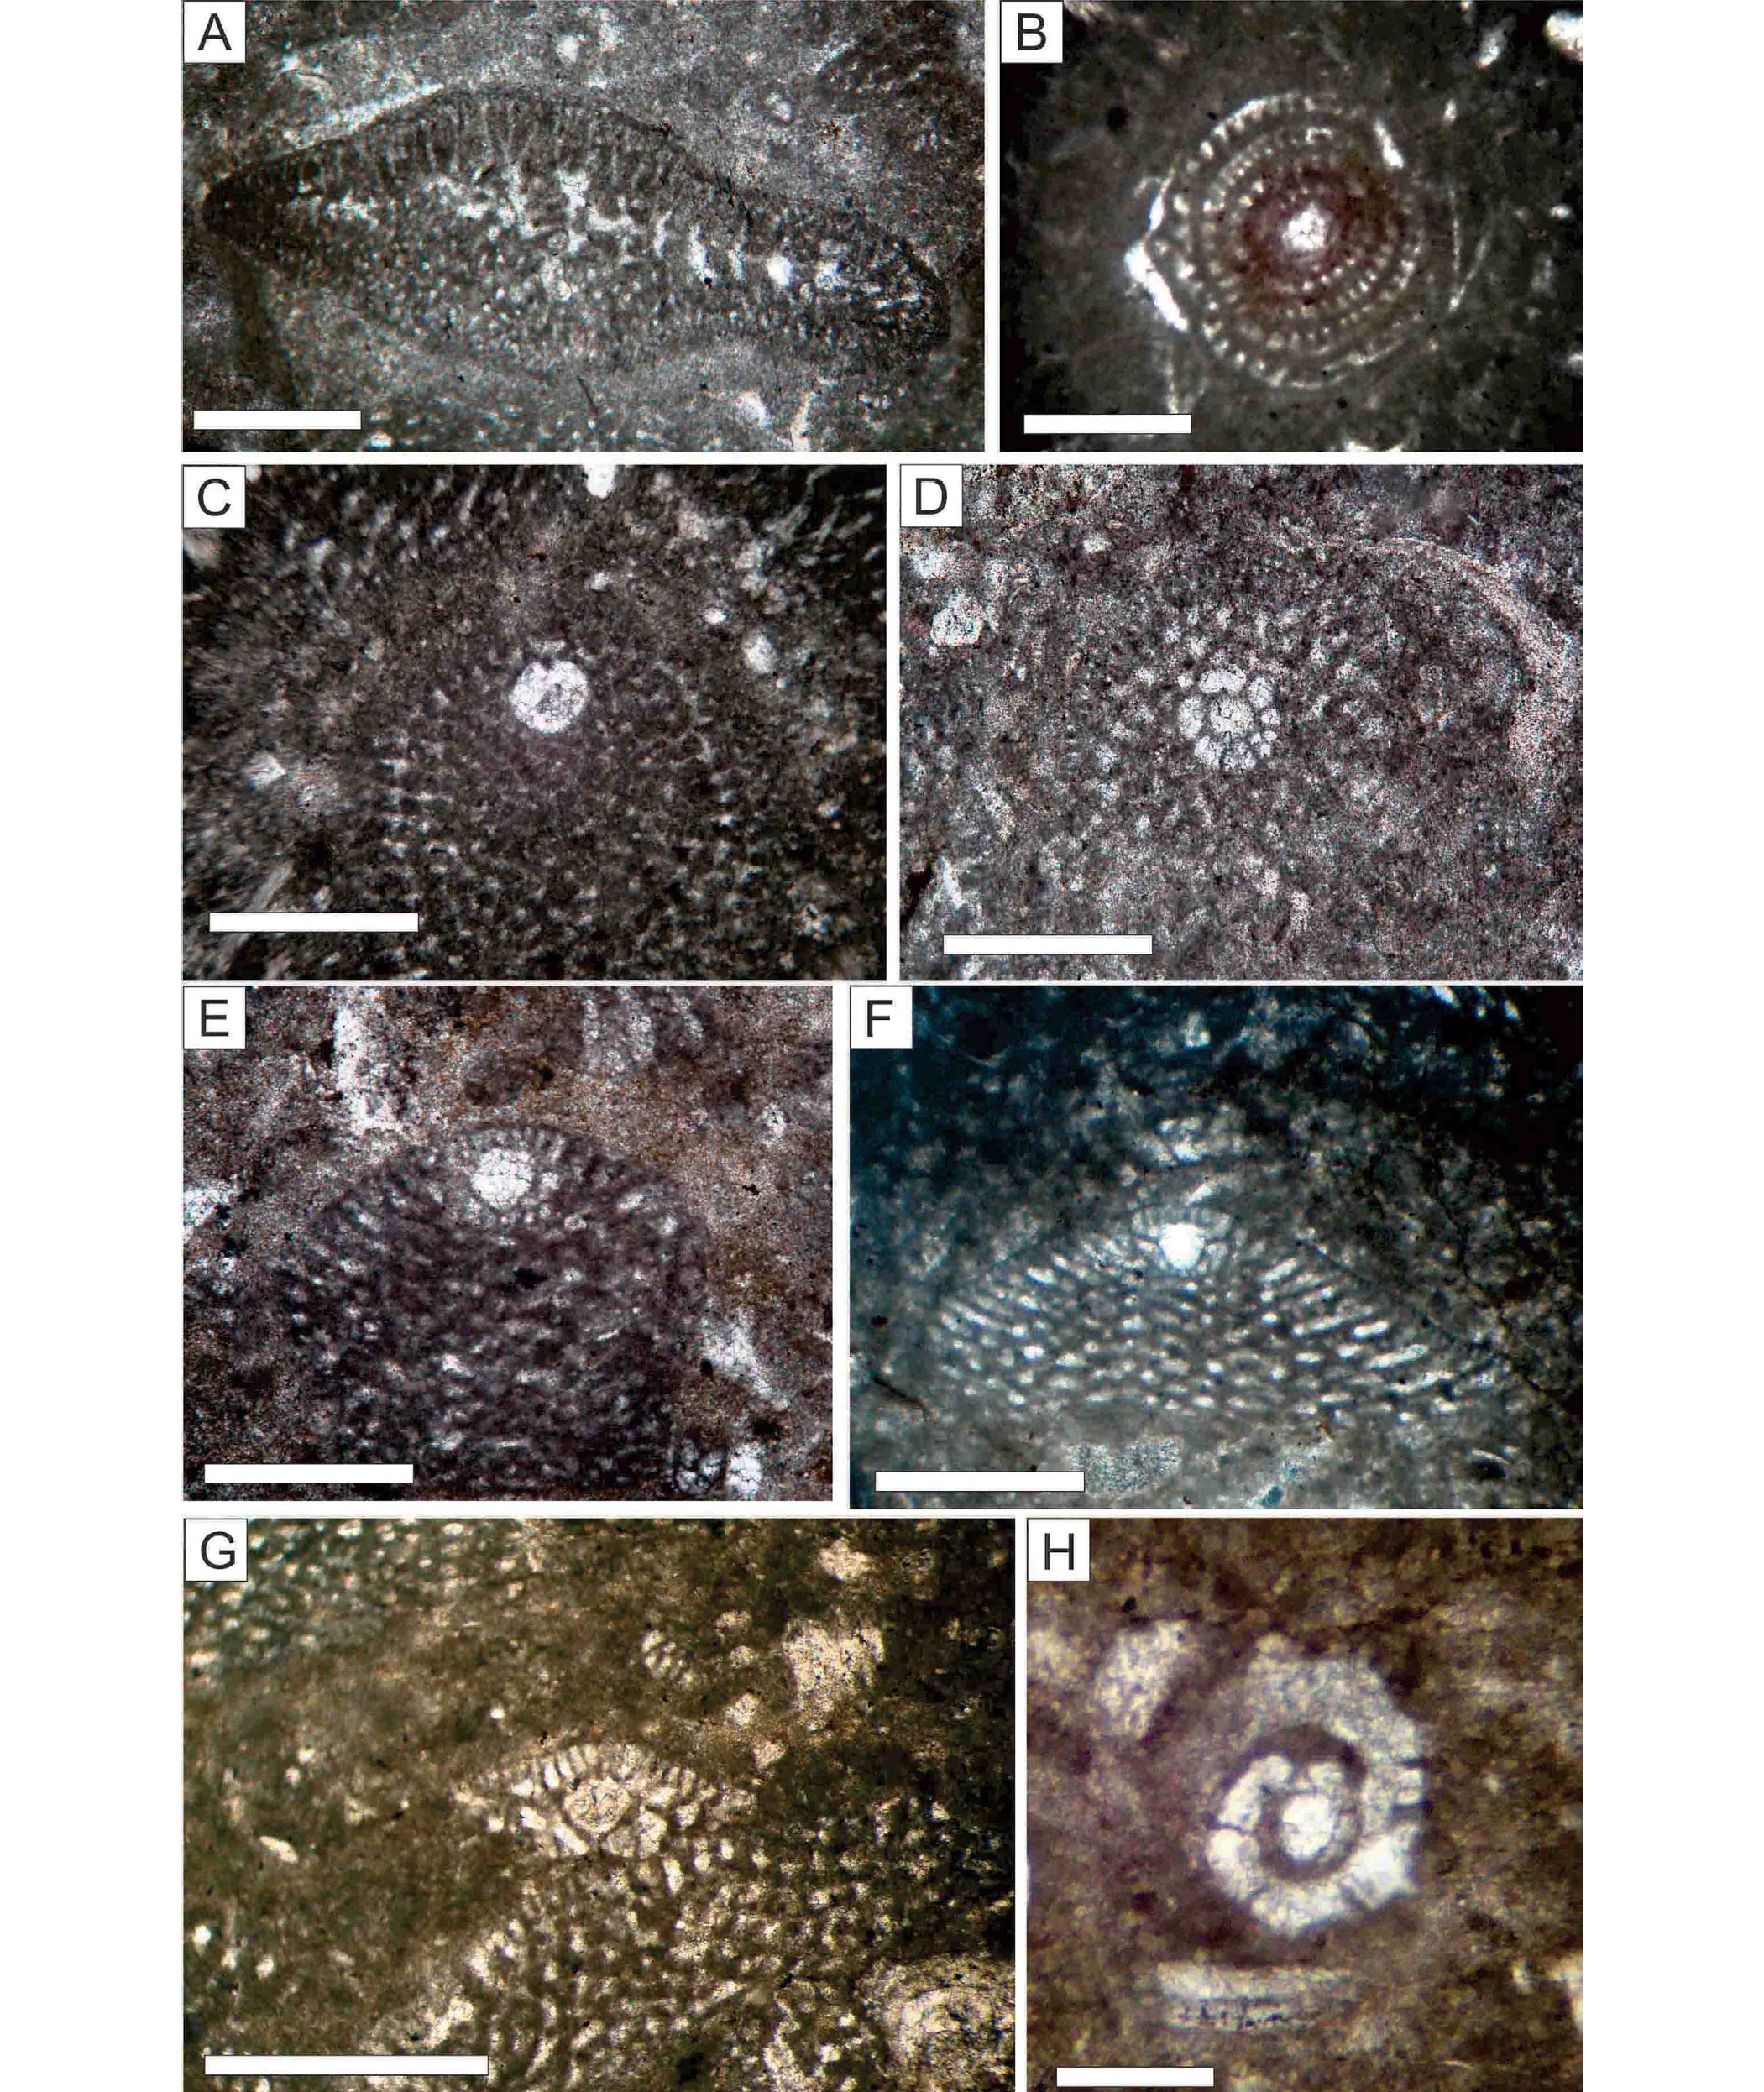 |
|
Figure 8. Thin section images (PPL) of the benthic foraminifera used in the biostratigraphy of the Lower Cretaceous deposits in this study. Scale bar: 0.5 mm. (A) Choffatella decipiens. (B) Archaealveolina sp. (C) Palorbitolina lenticularis. (D) Mesorbitolina parva, transversal section. (E) Mesorbitolina parva, axial section. (F) Mesorbitolina texana. (G) Mesorbitolina subconcava. (H) Hemicyclammina sigali. |
5.1.2 SHALLOW OPEN-MARINE SETTING
The shallow open-marine setting is characterized by the three facies: F5, F6, and F7. Accumulation of large fossil shells (3 to 4 mm in size) is typical for these facies.
The presence of brachiopods, bivalves (mainly rudists), and echinoids reflects a normal marine salinity and open-marine conditions (Bachmann and Harisch, 2006; Flügel, 2010; Aghaei et al., 2019). Also, the occurrence of discoidal orbitolinids can indicate open-marine conditions (Pittet et al., 2002) with relatively low water energy (Schroeder et al., 2010; Rahiminejad and Hassani, 2016a, 2016b). The faunal assemblages in the shallow open-marine facies are generally indicative of the euphotic zone (Romero et al., 2002; Corda and Brandano, 2003; Cosovic et al., 2004).
The decreasing-upward grain size distribution in the Exogyra marker shell bed of the lower unit of the Dariyan Formation (in the Seydan and Paskahak sections) (Figure 7H) can be representative of transport and redeposition of the components or grains (Pérez-López and Pérez-Valera, 2012; Rubert et al., 2012) and also moderate water energy resulting from intermittent wave energy and/or currents (Bover–Arnal et al., 2009). These sedimentary conditions reflect deposition below the fair-weather wave base and above the storm wave base (Corda and Brandano, 2003; Bover-Arnal et al., 2009; Bassi and Nebelsick, 2010).
 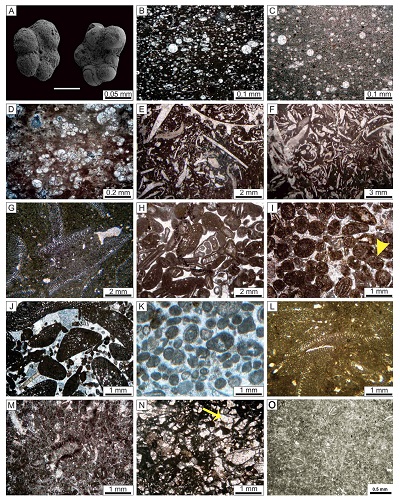 |
|
Figure 9. Thin section images of the facies in the studied Cretaceous deposits. Images B, D and L: XPL. Other images: PPL. (A) Planktic foraminifera in the shales and marls of the ‘Kazhdumi Tongue’ (the Paskahak and Seydan sections). (B) Radiolarian packstone with a lime-mud matrix containing organic matter (F3) (the Paskahak section). (C) Radiolarian wackestone with a lime-mud matrix (F3) (the Paskahak section). (D) Planktic foraminifera packstone with organic matter in the matrix (F4) (the Seydan section). (A–D: deep open-marine.) (E) Bioclastic packstone with bivalve shells (F5) (the Seydan section). (F) Bioclastic rudstone with poorly rounded grains (F6) (the Sangsiah section). (G) Discoidal orbitolinid rudstone (F7) (the Sangsiah section). (E–G: shallow open-marine.) (H) Bioclastic grainstone (F8). Small size orbitolinids, gastropods, and bivalve debris are present in the facies. Micrite envelope edge is clear around the components (the Sangsiah section). (I) Ooid grainstone (F9) in cross-bedded limestones (the Sangsiah section). Green algae is indicated by yellow arrow. (J) Peloidal orbitolinid grainstone. The facies contains conical to discoidal orbitolinids and peloids. The grains in the facies have been rounded as a result of agitation (F10) (the Sangsiah section). (K) Well-sorted peloidal grainstone; small benthic foraminifera are subordinate. Size and shape of peloides reflect lithic origin for these grains (F11) (H–K: shoal). (L) Orbitolinid packstone (F12) (the Sangsiah section). The facies contains conical orbitolinids. (M) Peloidal foraminifera packstone with milliolid benthic foraminifera (F13) (the Sangsiah section). (N) Peloidal green algae wackestone/packstone (F14) (the Sangsiah section). The algae in the facies are represented by the species Lithocodium aggregatum (yellow arrow). (O) Miliolid mudstone (F15). (L–O: lagoon). |
5.1.3 SHOAL SETTING
The shoal setting (Figure 10) is characterized by a bioclastic, ooidal, and peloidal-grainstone facies (facies F8–F11) with a grain-supported texture and abundant non-skeletal grains (ooids and peloids).The presence and distribution of a grain-supported texture, sparite calcite and/or sparitic cement, well-sorted grains, ooids (mainly concentric), and lithic peloids in the grainstone facies indicate high turbulence affecting small-scale bioclastic/ooidal shoals above the fair-weather wave base (Burchette and Wright, 1992; Masse et al., 2003; Palma et al., 2007; Bover-Arnal et al., 2009; Wilmsen et al., 2010; Rahiminejad and Zand-Moghadam, 2018; Aghaei et al., 2019; Raoufian et al., 2019). Also, cross-bedding in the grainstone deposits represents high-energy conditions (Sandulli and Raspini, 2004; Bachmann and Hirsch, 2006; Palma et al., 2007; Wilmsen et al., 2010). Shoal facies is only present in the Sangsiah section (Figure 4).
5.1.4 LAGOONAL SETTING
The lagoonal setting (Figure 10) is represented by facies types F12 to F15. Peloids, green algae, and benthic foraminifera (orbitolinids and miliolids) are the most abundant grains in the micritic matrix. The abundance of lime mud and the absence of high-energy textures and sedimentary structures in facies F12 to F15 reflect a low-energy environment (Adachi et al., 2004). The abundance of conical orbitolinids indicates a well-illuminated shallow-water environment (Husinec et al., 2000; Renema and Troelstra, 2001; Pittet et al., 2002; Schroeder et al., 2010; Rahiminejad and Hassani, 2016a, 2016b). The lack of stenohaline organisms and the abundance of euryhaline fauna may point to restricted water circulation in the lagoonal setting (Bosence and Wilson, 2003; Masse et al., 2003; Mancinelli, 2006). However, restricted water circulation in this lagoon is not to be confused with circulation in generally restricted or isolated environments (Read, 1985; Ghabeishavi et al., 2010). The abundance of miliolids and textularids (Vaziri-Moghaddam et al., 2006; Martini et al., 2007; Badenas and Aurell, 2010; Rahiminejad et al., 2018) and green algae (Lithocodium) indicates restricted lagoon conditions (Geel, 2000; Penney and Racey, 2004; Bachmann and Hirsch, 2006; Mansouri-Daneshvar et al., 2015). The lagoon facies was identified in all three studied sections of the Dariyan Formation.
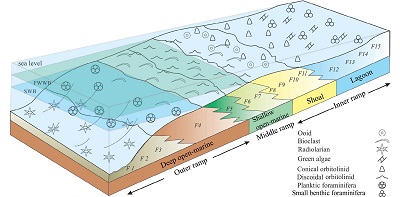 |
|
Figure 10. Schematic model proposed for deposition of the Lower Cretaceous deposits in this study. The Dariyan Formation was deposited in deep open-marine, shallow open-marine (o. m.), shoal, and lagoonal settings on a homoclinal ramp. F1: Shale; F2: Marl; F3: Radiolarian wackestone/packstone; F4: Planktic foraminifera wackestone/packstone; F5: Bioclastic wackestone/packstone; F6: Bioclastic rudstone; F7: Discoidal orbitolinid rudstone; F8: Bioclastic grainstone; F9: Ooid grainstone; F10: Peloidal orbitolinid grainstone; F11: Peloidal grainstone; F12: Orbitolinid packstone; F13: Peloidal foraminifera wackestone/packstone; F14: Peloidal green algae wackestone/packstone; F15: Miliolid mudstone. FWWB: fair weather wave base. SWB: storm wave base. |
5.2. GENERAL DEPOSITIONAL MODEL OF THE DARIYAN FORMATION
The facies types descibed here and their interpretation point to a ramp-type carbonate platform. The lagoon and generally, the shoal settings developed on the inner part of the ramp, whereas the shallow and deep open-marine settings developed on the middle and outer ramp settings (Figure 10).
This general interpretation is in agreement with the lack of genuine slope facies and structures, such as deep-water breccias, reef buildings and faunal frameworks (which can produce rimmed shelves). Moreover, the presence of grain-supported facies in the shoal setting, and the uniform trend of sediment production or accumulation from the shallow open-marine setting towards the deep open-marine setting are all in agreement with a ramp morphology (for interpretation see Read, 1985; Pomar, 2001; Van Buchem et al., 2010; Piryaei et al., 2011; Bai et al., 2017; Aghaei et al., 2019). More specifically, the presence of open-marine, shoal, and lagoonal settings with gradual lateral and vertical changes (Figures 4 to 6 and 10) points to a homoclinal ramp with a gentle slope (Read 1985; Burchette and Wright 1992). Along these lines, the lack of turbidite facies and peri-platform talus (Mcllreath and James, 1984; Payros and Pujalte 2008) in the studied sections supports this concept.
On the other hand, the facies characteristics of the lower unit of the Dariyan Formation in the Seydan and Paskahak sections, and the presence of the deep open-marine setting, reflect deposition in an intra–shelf basin environment (Burchette and Wright, 1992; Cosovic et al., 2004; Flügel, 2010). The limited development of the deep open-marine setting indicates that the intra-shelf basin in the Seydan and Paskahak sections was rimmed by shallow carbonate-platform deposits (Ziegler, 2001; Van Buchem et al., 2010).
5.3. SEQUENCE STRATIGRAPHY
Change in stacking pattern of strata is a response to the interaction between accommodation and sedimentation rate (Catuneanu et al., 2009, 2011). Sediment accommodation in marine environments is controlled by basin tectonic, subsidence, and sea-level changes on a global scale, whereas sedimentation rate reflects sediment supply (transportation of materials from land and in situ production) and conditions in the basins (Strasser and Samankassou, 2003; Catuneanu et al., 2011). Here, we follow the concepts presented in Catuneanu et al. (2009, 2011). A sequence is defined as sediments between lower and upper boundaries—known as sequence boundaries (SB)—with an abrupt change from a shallowing upward trend to a deepening upward trend. Since in this study the sequence boundaries do not represent any evidence of subaerial exposure, they are regarded as type 2 boundaries. The depositional sequences in the sections of the Dariyan Formation consist of transgressive systems tracts (TSTs) and highstand systems tracts (HSTs), which are characterized by deepening- upward trends and shallowing-upward trends, respectivelly (Figures 4 to 6 and 11). The TSTs and HSTs are separated by maximum flooding surfaces (MSFs) (Figures 4 to 6 and 11). The definition of the orders of sequences is based on the time framework followed by Catuneanu et al. (2009, 2011) and Haq et al. (1988).
Given that the Dariyan Formation in the studied sections is early Aptian to early Albian in age (about 15 My as based on the GTS 2004 time scale; Gradstein et al., 2004; Al-Husseini and Matthews, 2010), a third-order assignment is here proposed for the sequences observed. Hence, we define three third-order depositional sequences (Ds1, Ds2, and Ds3) (Figures 4 to 6 and 11). The conceptual correlations between the depositional sequences of the Dariyan Formation in the studied sections are shown in Figure 11. Depositional sequence 1 and Ds2 comprise TSTs followed by HSTs. In contrast, Ds3 comprises a TST, which its upper boundary is contemporaneous with the boundary between the Dariyan and the Kazhdumi formations (Figures 4 to 6 and 11). The sequence boundaries in all the sequences of the Dariyan Formation belong to the type 2 (SB2) (Figures 4 to 6 and 11). Generally, the Dariyan Formation was deposited on top of the Gadvan Formation during a Aptian sea-level rise (Sharland et al., 2001). The boundary between the Gadvan and the Dariyan formations, which was described as an isochronous boundary in the region (Schroeder et al., 2010), has been regarded as a baseline for the reconstruction of sea-level changes (Van Buchem et al., 2010). The identified depositional sequences in the Dariyan Formation in this study are as follows:
5.3.1 DEPOSITIONAL SEQUENCE 1 (DS1)
In the sections of the Dariyan Formation (Figures 4 to 6 and 11), Ds1 commences with the deposition of carbonates on the upper shale unit of the Gadvan Formation. The lower boundary (SB2–1) of the Ds1, which is the transgressive surface of the Dariyan Formation carbonates, is marked by an abrupt lithological change from shale to limestone and is well recognizable with respect to the erosion of the shale deposits of the upper part of the Gadvan Formation (Figures 4 to 6 and 11).
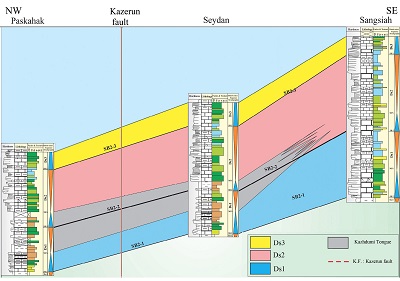 |
|
Figure 11. Lithostratigraphic and sequence stratigraphic correlation of the three sections (Paskahak, Seydan, and Sangsiah) of the Dariyan Formation. Biostratigraphic details indicate that the Dariyan Formation in the sections is early Aptian to early Albian in age (see Figures 4 to 6 and 8). The legends for the lithological, facies, and sequence stratigraphical details of the formation in the sections are shown on Figures 4–6. Ds: depositional sequence. SB2: type 2 sequence boundary. |
Additionally, yellow limonitic bioturbations (Figure 7K) were identified at this boundary (in the base of the lower unit of the Dariyan Formation). In the Seydan and Paskahak sections, the deposits in the basal part of the Ds1 are mainly characterized by the packstone and wackestone facies containing bivalves and oyster bioclasts. In the Sangsiah section, the basal part of the Ds1 is marked by the packstone to grainstone facies containing benthic foraminifera such as conical orbitolinids. These facies types are representative of the first transgression resulting from sea-level rise. In the Seydan and Paskahak sections, the upward-decreasing trend of the thicknesses of the beds (towards the upper part of the Dariyan Formation) in the Dariyan Formation and also the presence of the planktic foraminifera and radiolarian-bearing facies are indicative of a TST (in the relevant deposits, nodules and thin grey to black silicified intercalations are observed). At the end of the transgressive trend, the deposition of radiolarian-rich packstone facies (deep, open-marine,) indicates a maximum flooding surface (MFS). In the Seydan and Paskahak sections, this interval is clearly recognizable by intense bioturbations and accumulations of small ammonites (~ 3 cm in size). The first TST in the Paskahak and Seydan sections is 32 m and 37 m thick, respectively. Simultaneously, in the Sangsiah section (Figure 4), the change of lagoon packstone facies into shoal grainstone facies and discoidal orbitolinid-rich facies of the shallow open-marine setting, reflects a sea-level rise (TST) recorded in a 40-m thick carbonate succession.
This deepening trend ends with the deposition of the packstone and rudstone facies with discoidal orbitolinids and remains of bivalves and echinoids that indicate the end of the deepening-upward trend and the maximum flooding surface (MFS). In the Sangsiah section, the deposits overlying the MFS boundary mainly contain remains of bivalves and discoidal orbitolinids. In upper portions of the section, poorly-washed facies intercalated with shoal grainstone facies is present. This shallowing-upward trend subsequently leds to ooidal and bioclastic grainstone facies best interpreted as HST. The upper boundary of this facies is equivalent to a second-sequence boundary or the upper boundary of Ds1 (SB2–2). The systems tract is 43 m thick. Equivalents of such facies in the Seydan (34 m thick) and Paskahak (43 m thick) sections include shales, marls, and planktic foraminifera-bearing argillaceous limestones. These are considered the normal deposits of deep-marine settings and qualify as a HST. At the end of the HST, planktic foraminifera-bearing marls are replaced by argillaceous limestones containing discoidal orbitolinids and fragments of bivalves. The upper surface of the orbitolinid-bearing beds is the upper boundary of the first sequence (SB2–2) in the Seydan and Paskahak sections. At this boundary, deposits with scattered small horizontal tunnel-shaped bioturbations (7–10 mm in diameter) are present. Generally, the presence of benthic foraminifera such as Choffatela decipiens and Palorbitolina lenticularis in the deposits and the appearance of Mesorbitolina parva in the upper boundary of the Ds1 in the studied sections documents that the DS1 in the Dariyan Formation is early Aptian in age (Figures 4 to 6).
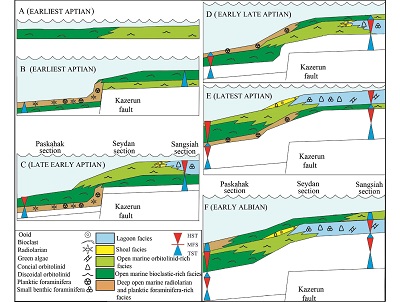 |
|
Figure 12. Schematic models of the sequence evolution representing the relative influence of sea-level changes and tectonic subsidence in the studied sections (not to scale). (A) Initial sea-level transgression or sea-level rise and initial deposition of the Dariyan Formation on the Barremian Gadvan Formation (earliest Aptian). (B) Deposition of radiolarian-bearing facies of the Dariyan Formation during deep open-marine subsidence and sea-level rise (earliest Aptian). (C) Highstand systems tracts led to deposition of orbitolinid-rich facies in the deep open-marine setting (outer ramp) (late early Aptian). (D) Sea-level rise led to deposition of planktic foraminifera-bearing deposits (early late Aptian). (E) Sea-level fall and progradation of platform top (shallow open-marine, shoal, and lagoonal settings) deposits into the outer ramp (deep open-marine setting) (latest Aptian). (F) Deposition of the Albian Kazhdumi Formation on the Aptian–Albian Dariyan Formation during the sea-level rise (early Albian). |
5.3.2 DEPOSITIONAL SEQUENCE 2 (DS2)
In the Seydan and Paskahak sections (Figures 5 to 6 and 11), the Ds2 is recognized by a change in lithology from shallow open-marine setting argillaceous limestones (with wackestone to packstone facies) to planktic foraminifera-bearing shales of the outer ramp. The lower boundary of the Ds2 correlates and overlaps with the upper boundary of the Ds1 (SB2–2). The planktic foraminifera-bearing marls and shales combined with intercalations of planktic foraminifera-bearing argillaceous limestones form a TST (thicknesses of 16 and 25 m in the Seydan and Paskahak sections, respectively) in the Ds2. The upper boundary is regarded as a maximum flooding surface.
In the Sangsiah section (Figures 4 and 11), the TST (31 m thick) is defined by the occurrence and distribution of the floatstone to rudstone facies containing discoidal orbitolinids. A deepening trend led to development of bioclastic packstone to rudstone facies as the deepest facies in this sequence. The upper surface of the stratigraphic interval with packstone facies (containing bioclasts of echinoid and bivalve) reflects the maximum flooding surface in the Ds2 and is the equivalent to the MFS (the surface above the planktic foraminifera-bearing shales and marls) in the Seydan and Paskahak sections (Figures 5 to 6 and 11).
In the Sangsiah section (Figures 4 and 11), the orbitolinid-rich facies and the shoal facies, such as ooidal and bioclastic grainstones directly overly the MFS. Following the deposition of these facies, a stratigraphically thick interval with lagoonal facies (mainly conical orbitolinid packstone–wackestone and packstone with small benthic foraminifera and green algae) was deposited in the Sangsiah section. This facies association, which is representative of a shallowing–upward trend in the Dariyan Formation, is best interpreted as the HST in the Ds2. At the end of the HST, restricted lagoon deposits containing milliolid, pelloids, and green algae were deposited. The upper boundary is interpreted as the upper boundary of the Ds2 (SB2–3). The HST is 80 m thick.
In the Seydan and Paskahak sections, the deposits, which are equivalent to the HST in the Sangsiah section, overlie the maximum-flooding surface with an abrupt change in lithology. Across this surface or thin interval, packstone facies containing debris of echinoids and bivalves, combined with rudstone facies comprising discoidal orbitolinids, overlie the planktic foraminifera-bearing marls. These facies are followed by a thick succession of lagoon facies mainly including packstone with conical orbitolinids and other benthic foraminifera. The orbitolinids in the facies are reworked and the marginal parts of their tests are commonly eroded. In the Seydan and Paskahak sections, the surface above the stratigraphic interval representing lagoonal facies is the upper boundary of the Ds2 (SB2–3). In the two sections, the thicknesses of the HST are 91 m and 69 m, respectively.
In the studied sections of the Dariyan Formation, the co-occurrence of Mesorbitolina parva and Mesorbitolina texana in the lower and middle parts of the Ds2, as well as the presence of Mesorbitolina texana and Mesorbitolina subconcava in the upper parts, document that Ds2 is late Aptian in age (Figures 4 to 6).
5.3.3 DEPOSITIONAL SEQUENCE 3 (DS3)
This sequence is the stratigraphically highest and the youngest depositional sequence of the Dariyan Formation in the studied sections (Figures 4 to 6 and 11). This sequence consists of a TST. The occurrence of Mesorbitolina subconcava in the Ds3, as well as the appearance of Hemicyclamina sigali at the end of the Ds3 indicate a latest Aptian to earliest Albian in age (Figures 4 to 6 and 8).
The presence of orbitolinid wackestone facies with discoidal orbitolinids is indicative of a sea-level rise and the deposition of a TST in the Seydan (42 m thick) and Paskahak (31 m thick) sections. The deepening-upward trend of the facies is followed by orbitolinids-rich packstone to rudstone and then by bioclastic packstone towards the upper boundary of the Dariyan Formation. The TST deposits mainly consist of discoidal orbitolinid-bearing limestones. In the boundary between the Dariyan Formation and the overlying Kazhdumi Formation, bioturbation is intense and clearly reflects a decrease in sedimentation rate (omission). Although the omission surface can be considered as a maximum-flooding interval, it is perhaps best interpreted as a flooding surface due to a facies deepening-upward trend from the Dariyan Formation towards the Kazhdumi Formation. This trend is defined by the change in lithology from the orbitolinid-bearing limestones of the Dariyan Formation to the marls (with bivalve shells) and planktic foraminifera-bearing shales of the Kazhdumi Formation. The systems tract, however, represents the first phase of a transgression, which is followed by the second phase in the overlying deposits (e.g., Van Buchem et al., 2010). The maximum flooding interval is present in the Kazhdumi Formation.
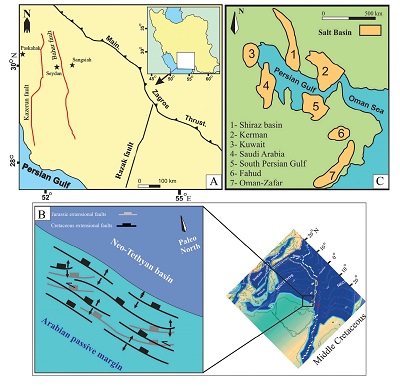 |
|
Figure 13. (A) Dispersion pattern of the strike-slip basement faults in the Zagros belt. The studied sections are marked by black stars (Simplified from Tavakoli et al., 2008). (B) Extensional fault systems in the northeastern part of the Arabian Plate during the Aptian (Navabpour, 2010). (C) Salt basin dispersion around the Persian Gulf. (Simplified from Motiei, 1993). |
In the Sangsiah section (platform top; including shallow open-marine, shoal, and lagoon), the TST (42 m thick) in the Ds3 is marked by a change from wackestone to packstone (containing small, benthic foraminifera (milliolid) and green algae) to conical orbitolinid-bearing limestones and ooid grainstone. This is followed by bivalve-debris-bearing, bioclastic grainstone. The transgressive trend continues by deposition of discoidal, orbitolinid-rich packstone to rudstone and is interrupted by bioclastic rudstone facies containing fragments of bivalves and echinoderms. Based on the abundancy of bioturbations and the deepening-upward trend above the top surface of the Dariyan Formation, this upper boundary might represent a flooding surface. The sea-level rise resulted in conformable deposition of the Kazhdumi Formation on the Dariyan Formation.
- Discussion
Although facies, depositional environments and sequences of the Dariyan Formation have been studied in different areas of the Zagros belt (Table 1), more recent studies (e.g., Mansouri-Daneshvar et al., 2015; Mehrabi et al., 2015; Naderi-Khujin et al., 2016) have been mainly focused, driven by its importance as reservoir unit, on subsurface sections of the Dariyan Formation in the Persian Gulf area (Table 1).
On a larger scale, the sea-level patterns recorded in the Dariyan Formation as reported here are consistent with Early Cretaceous sea-level reconstruction for the Arabian Plate (Figures 4 to 6) (Sharland et al., 2001; Ziegler, 2001; Van Buchem et al., 2010).
|
Table 1. Comparison of concepts presented here with previous studies. Recent studies have been mainly focused on subsurface sections of the Dariyan Formation in the Persian Gulf Area due to the important reservoir characteristics of this formation. |
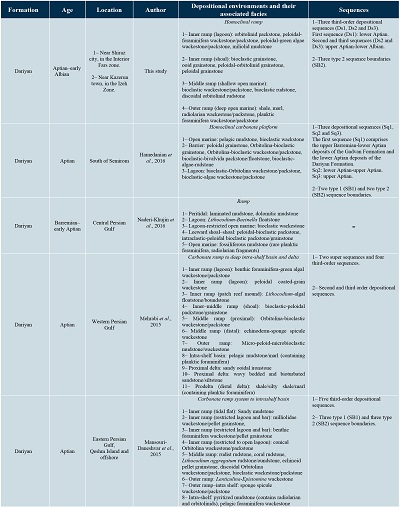 |
Late Barremian to early Aptian sea-level rise resulted in shifting of siliciclastic systems landward and towards their sources and also led to precipitation of siliciclasts in the coastal zones in the west of the basin in the Arabian Plate (Davies et al., 2002). Sea-level rise or transgression in Saudi Arabia is marked by completion of deposition of the Zubair Formation and its equivalent deltaic siliciclastic deposits (Al-Fares et al., 1998) and a change of fluvial deposits of the Biyadh Formation to the marine carbonates of the Shuaiba Formation (Hughes, 2000). Siliciclastic discharge provided favourable conditions for the deposition of the Dariyan Formation and the contemporenous carbonate successions to the east of the Arabian Plate (Sharland et al., 2001; Davies et al., 2002; Van Buchem et al., 2010).
The maximum flooding surface in the Ds1 of the Dariyan Formation in this study is consistent with the upper lower Aptian K80 maximum flooding surface (K80 MFS) of the Arabian Plate (Sharland et al., 2001; Haq and Al-Qahtani, 2005). Deposits associated with K80 MFS have been reported from different parts of the Arabian plate. In the United Arab Emirates, the K80 MFS has been identified in the Bab Tar (source rock) unit of the Shuaiba Formation (Grotsch et al., 1998; Sharland et al., 2001). This surface, which is reflected by a deep facies comprising planktic foraminifera and organic materials, formed during the evolution of the Bab Basin (Grotsch et al., 1998). In Qatar, the K80 MFS is defined by the occurrence of planktic foraminifera-bearing deposits in the upper part of the Shuaiba Formation (Sharland et al., 2001). Also, in the west of Oman the K80 MFS is indicated by the presence of planktic foraminifera mudstone and kerogen-bearing wackestone (Witt and Gökdag, 1994).
In the Seydan and Paskahak sections of the Dariyan Formation, the K80 MFS lies on the pelagic limestones comprising organic materials and oil stains. Generally, the sea-level rise at the end of the early Aptian has been assigned to an eustatic trend (Sharland et al., 2001; Haq and Al-Qahtani, 2005). This transgression or sea-level rise has been associated with the Aptian oceanic anoxic event (OAE 1a) (Leckie et al., 2002; Jenkyns, 2010; Moosavizadeh et al., 2014), resulting from greenhouse conditions, which were related to high input of CO2 into the atmosphere during volcanic activities (Weissert and Erba, 2004; Mehay et al., 2009). Global warming triggered by such conditions could have led to melting of ice sheets (Frakes et al., 2005) and the subsequent global sea-level rise (Skelton and Gili, 2012). In some parts of the Arabian Plate (e.g., the Bab Basin in the United Arab Emirates and the Kazhdumi Basin and the Izeh Zone in Iran), tectonic subsidence enhanced the relative sea-level rise (Sharland et al., 2001; Ziegler, 2001; Van Buchem et al., 2010). The deposition of the Dariyan Formation in the Paskahak section in the Izeh Zone was controlled by tectonic subsidence. According to Van Buchem et al. (2002, 2010) and other workers, a sudden facies deepening-upward trend is the main evidence of the role of tectonic subsidence in increasing sea-level rise in such basins (Sharland et al., 2001; Ziegler, 2001).
The activities of the Kazerun and Hendijan strike-slip faults are considered the main parameters controlling the basin subsidence in the Kazhdumi Basin during the early Aptian (Sharland et al., 2001; Ziegler, 2001; Van Buchem et al., 2010). The Kazerun fault system with a north-trending dextral strike-slip fault is one of the basement structures that probably originated from the Pan-African basement from a Neoproterozoic tectonic phase and divides the Zagros into two separate along-strike blocks (Talbot and Alavi, 1996; Nankali, 2011). The fault activity controlled the sedimentation pattern and structural deformation of the Phanerozoic deposits and remains seismically active to the Present day (Tavakoli et al., 2008). Based on the isopach and facies maps of the Zagros belt (Setudehnia, 1978; Koop and Stoneley, 1982), the activity of the Kazerun and Izeh faults controlled the sedimentation patterns of this belt in the Early Cretaceous (Sepehr and Cosgrove, 2004, Nankali, 2011). Van Buchem et al. (2010) documented that the vertical movements of the Kazerun and Hendijan faults resulted in a subsidence with a thickness of about 170 m during the late early Aptian to the early Albian in the basin.
A similar facies change has been also reported from the Cenomanian–Turonian (Sarvak Formation) and the Campanian–Eocene (Gurpi and Pabdeh formations) deposits (Sepehr and Cosgrove, 2004). Facies changes resulted from the activity of the Kazerun fault, which formed an area with rapid subsidence in the east and a more stable area in the west of the fault zone (Sepehr and Cosgrove, 2004). Additionally, during the Miocene, the Kazerun fault acted as a boundary that controlled the extension of the salt basin of the Gachsaran Formation (Sepehr and Cosgrove, 2004; Safaei, 2009). The subsidence resulted in formation of a depocenter, which is entirely surrounded by a shallow carbonate platform (James and Wynd, 1965; Sharland et al., 2001; Ziegler, 2001).
In this study, the abrupt deepening-upward trend in the Dariyan Formation (in the Paskahak and Seydan sections) was recorded in the TST in Ds1, where shallow-marine limestones switch to deep-marine argillaceous limestones rich in planktic foraminifera and radiolarians. Given that the equivalent deposits in the Sangsiah section display only a normal deepening-upward trend, and that the deep-water deposits of the Kazhdumi Tongue pinch out from the Seydan towards the Sangsiah sections (Figure 11), the abrupt facies change suggests that the relative sea-level rise was caused by tectonic subsidence (e.g., Ziegler, 2001; Van Buchem et al., 2010) (Figure 12). The tectonic subsidence in the Paskahak section in the Izeh Zone has been attributed to the Kazerun fault activity (Sharland et al., 2001; Ziegler, 2001; Van Buchem et al., 2010).
With respect to the geological features of the Seydan section and its surrounding area, three factors likely contributed to enhancing the subsidence in the eastern part of the Kazerun fault:
- The activity of another basement fault, the Bahar (Kareh–Bas) fault (e.g., Tavakoli et al., 2008) (Figure 13A). The tectonic features of this strike-slip fault are similar to those of the Kazerun fault. The two faults are parallel (Tavakoli et al., 2008; Nissen et al., 2011). The Bahar fault could have been active during the development of deep-marine settings, contemporaneous with the Kazerun fault.
- The middle Cretaceous extensional fault systems that have been reported by Navabpour et al. (2010) in the east of the Kazerun fault (Figure 13B). The activation of these fault systems which were synchronous with subduction of the Neo-Tethys oceanic crust toward the north, could have contributed to the subsidence in the eastern part of the Kazerun fault.
- The third factor is related to salt movement. The deposition of deep-water deposits in the Seydan section was contemporaneous with the formation and development of the Bab Basin (with deep-water planktic foraminifera and radiolarian-rich deposits) between Oman and the United Arab Emirates. In the Bab Basin, pelagic deposits of the Nahr Umr Formation are deposited and surrounded by carbonate-platform deposits of the Kharaib and Shuaiba formations (Sharland et al., 2001; Ziegler, 2001). In the basin, movement of the infra-Cambrian Hormuz Salt has been suggested as the main factor controlling the subsidence and formation of the Bab Basin (Sharland et al., 2001; Al-Ghamdi, 2006). With respect to the extension of the Hormuz salt basin in east and southeast of the Kazerun fault (the Shiraz Basin; Figure 13C) (Motiei, 1993), subsidence progressed towards the inner areas of the Interior Fars (east of the Kazerun fault). This feature was probably related to movement of the infra-Cambrian Hormuz Salt. Tectonic forces that resulted in the activity of the Kazerun and Bahar faults and/or the extensional fault systems triggered the salt movement (e.g., Sharland et al., 2001; Piryaei et al., 2011). The flow of salt diapirs and development of salt domes related to fault activity, is a feature that has been documented in the literature (e.g., Tavakoli et al., 2008; Navabpour et al., 2010; Nissen et al., 2011).
In the upper Aptian interval of the Seydan and Paskahak sections, a transgression which was mainly controlled by eustatic sea-level change was associated with the progradation of shallow orbitolinid-rich carbonate-platform facies over the shale and marl pelagic deposits of the top surface of the Kazhdumi Tongue. These pronounced lithological and facies changes witness the progradation of platform top deposits into the deepest part of the basin due to the rapid sea-level fall (i.e., forced regression; e.g., Sharland et al., 2001; Van Buchem et al., 2010). Moreover, the presence of grain-supported facies with eroded grains (such as orbitolinids) supports these interpretations. Based on the age of the upper unit of the Dariyan Formation (late Aptian) (Schroeder et al., 2010), deposition of the Ds2 co-occurred with a phase of global sea-level fall and subaerial exposure of a wide area of the Arabian Platform. Thus, on a regional scale, the carbonate deposits of the upper unit of the Dariyan Formation is a lowstand systems tract (LST) on the Arabian Platform (Sharland et al., 2001; Ziegler, 2001; Schroeder et al., 2010; Van Buchem et al., 2010; Maurer et al., 2013).
The subaerial exposures of the Arabian Platform, and the disconformity surface on the top of the Shuaiba and Qishn formations, have been reported from for example Oman (Rameil et al., 2012). Also, the subaerial exposure of the carbonate platform of the Dariyan Formation after the late early Aptian has been recorded as karstification in carbonate deposits and palaeosols in several sections such as Kuh-e-Gach and Kuh-e-Asaluyeh in north of the Persian Gulf region (coastal Fars province) (Van Buchem et al., 2010).
The subaerial exposure (of the platform top) and hiatal intervals in these sections resulted in development of a diachronous surface in the upper boundary of the Dariyan Formation (Schroeder et al., 2010; Van Buchem et al., 2010).
Moreover, late Aptian lowstand systems tract deposits have also been reported from other regions. Examples include the Russian platform where a pronounced sea-level fall resulted in an extensive erosion of the platform top deposits (Sahagian et al., 1996). Similarly extensive erosional events as well as deposits in incised valleys have also been recorded in the west of Siberia (Medvedev et al., 2011). Simultaneously, extensive subaerial exposures developed on the carbonate platforms in Portugal (Heimhofer et al., 2007) and Spain (Rodríguez-López et al., 2008). All of these features show that the carbonate platforms in the western margin of the Neotethys Ocean were subaerially exposed during the late Aptian (Maurer et al., 2013).
Detailed stratigraphic-sequence studies and oxygen isotope analyses revealed that during the late Aptian, periods of global cooling, contemporaneous with sea-level fall and subaerial exposures of platforms, prevailed (Maurer et al., 2013). Ice sheet dynamics and development and growth of ice caps have been considered as the most probable factors resulting in eustatic sea-level fall (Maurer et al., 2013). Transgression or sea-level rise in the Albian led to deposition of the Kazhdumi Formation on the carbonate deposits of the Dariyan Formation (Sharland et al., 2001; Ziegler, 2001). The relative effects of tectonic subsidence and relative sea-level changes in the studied sections of the Dariyan Formation are shown in Figure 12.
- Conclusions
The Lower Cretaceous Dariyan Formation was studied in three stratigraphic sections in the Interior Fars (the Sangsiah and Seydan sections) and the Izeh Zone (the Paskahak section) of the Zagros fold-thrust belt in the south-west of Iran. Based on the palaeontological studies, the following age assigning benthic foraminifera were identified in the Dariyan Formation: Choffatella decipiens, Archaealveolina sp., Palorbitolina lenticularis, Mesorbitolina parva, Mesorbitolina texana, Mesorbitolina subconcava, and Hemicyclammina sigali. The stratigraphic range of these foraminifera supports the notion that that the Dariyan Formation is early Aptian–early Albian in age.Detailed sedimentological and stratigraphic studies documented that the Dariyan Formation was deposited in deep open-marine, shallow open-marine, shoal, and lagoon depositional settings in the outer, middle, and inner parts of a homoclinal ramp.
Three type 2 sequence boundaries (SB2,) and three third-order depositional sequences (Ds1, Ds2 and Ds3) are here defined. The depositional sequences consist of three transgressive systems tracts (TSTs) and two highstand systems tracts (HSTs), respectively.
The following stages explain the deposition of the Aptian–Albain Dariyan Formation in the studied area:
- Earliest Aptian: sea-level rise and initial deposition of the Dariyan Formation sediments on the Barremian Gadvan Formation.
- Earliest Aptian: deposition of the radiolarian-bearing facies of the Dariyan Formation during deep open-marine subsidence and sea-level rise.
- Late early Aptian: deposition of orbitolinid-rich facies in the deep open-marine setting
- due to the formation of highstand systems tracts (HSTs).
- Early late Aptian: deposition of planktic foraminifera-bearing facies during the subsequent sea-level rise.
- Latest Aptian: progradation of the platform top (shallow open-marine, shoal, and lagoon) deposits of the Dariyan Formation into the deep open-marine setting due to the sea-level fall.
- Early Albian: deposition of the Albian Kazhdumi Formation on the Aptian–Albian Dariyan Formation during the subsequent sea-level rise.
Generally, the development of the deep open-marine facies in the Dariyan Formation was related to the subsidence controlled by fault activities during the Aptian.
Work show here suggests that the sea-level patterns recorded for the Dariyan Formation are consistent with the record of relative and eustatic sea level described throughout the Arabian Plate.
Acknowledgements
A part of this research (study of the Paskahak section) was financially supported by Shahid Bahonar University of Kerman. The authors gratefully acknowledge the Editor-in-Chief (Dr. Antoni Camprubí) and the reviewers for their helpful suggestions and comments that improved the manuscript. The authors gratefully appreciate Prof. Adrian Immenhauser (Ruhr-Universität Bochum, Bochum, Germany) for his very valuable contribution to improving the English edition of the manuscript.
References
Adachi, N., Ezaki, Y., Liu, J., 2004, The fabrics and origins of peloids immediately after the end-Permian extinction, Guizhou Province, South China: Sedimentary Geology, 164(1-2), 161–178. https://doi.org/10.1016/j.sedgeo.2003.10.007
Aghaei, A., Zand-Moghadam, H., Moussavi-Harami, R., Mahboubi, A., 2019, Sequence stratigraphic analysis and sea-level history of the Upper Jurassic deposits (Mozduran Formation), south of Aghdarband, NE Iran: Historical Biology, 31(8), 1097-1114. https://doi.org/10.1080/08912963.2017.1421184
Alavi, M., 2004, Regional stratigraphy of the Zagros fold-thrust belt of Iran and its proforeland evolution: American Journal of Science, 304(1), 1–20. https://doi.org/10.2475/ajs.304.1.1
Alavi, M., 2007, Structures of the Zagros fold–thrust belt in Iran: American Journal of Science, 307(9), 1064–1095. https://doi.org/10.2475/09.2007.02
Al-Fares, A.A., Bouman, M., Jeans, P., 1998, A new look at the Lower to Middle Cretaceous stratigraphy, offshore Kuwait: GeoArabia, 3(4), 543–560.
Al-Ghamdi, N.M., 2006, Facies, Sequence Framework, and Evolution of Rudist Buildsup, Shu’aiba Formation, Saudi Arabia: Virginia, U.S.A., the Virginia Polytechnic Institute and State University, MSc thesis.
Al-Husseini, M.I., Matthews, R.K., 2010, Tuning Late Barremian–Aptian Arabian Plate and global sequences with orbital periods, in Van Buchem, F.S.P., Al-Husseini, M.I., Maurer, F., Droste, H.J. (eds.), Barremian−Aptian stratigraphy and hydrocarbon habitat of the eastern Arabian Plate: Manama, Bahrain, GeoArabia Special Publication 4, 199–228.
Bachmann, M., Hirsch, F., 2006, Lower Cretaceous carbonate platform of the eastern Levant (Galilee and the Golan Heights): stratigraphy and second-order sea-level change: Cretaceous Research, 27(4), 487–512. https://doi.org/10.1016/j.cretres.2005.09.003
Badenas, B., Aurell, M., 2010, Facies models of a shallow-water carbonate ramp based on distribution of non-skeletal grains (Kimmeridgian, Spain): Facies, 56(1), 89–110. https://doi.org/10.1007/s10347-009-0199-z
Bai, H.Q., Betzler, C., Erbacher, J., Reolid, J., Zuo, F., 2017, Sequence stratigraphy of Upper Jurassic deposits in the North German Basin (Lower Saxony, Süntel Mountains): Facies, 63(3), 19. https://doi.org/10.1007/s10347-017-0501-4
Bassi, D., Nebelsick, J.H., 2010, Components, facies and ramps: redefining Upper Oligocene shallow water carbonates using coralline red algae and larger foraminifera (Venetian area, northeast Italy): Palaeogeography, Palaeoclimatology, Palaeoecology, 295(1-2), 258–280. https://doi.org/10.1016/j.palaeo.2010.06.003
Berberian, M., King, G., 1981, Towards a paleogeography and tectonic evolution of Iran: Canadian Journal of Earth Sciences, 18(2), 210–265. https://doi.org/10.1139/e81-019
Beydoun, Z.R., Clarke, M.W.H., Stoneley, R., 1992, Petroleum in the Zagros Basin: a late Tertiary foreland basin overprinted onto the outer edge of a vast hydrocarbon-rich Paleozoic–Mesozoic passive-margin shelf, in Macqueen, R.W., Leckie, D.A. (eds.), Foreland Basins and Fold Belts, No. 55: American Association of Petroleum Geologists Memoir, 309–339.
Bosence, D.W.J., Wilson, R.C.L., 2003, Carbonate depositional systems, in Coe, A.L. (ed.), The Sedimentary Record of Sea-Level Change: Milton Keynes, UK, Cambridge University Press, 209–233.
Boudagher-Fadel, M.K., 2008, Evolution and geological significance of larger benthic foraminifera: Amsterdam, Netherlands, Elsevier, 571 p. https://doi.org/10.1016/s0920-5446(08)00012-5
Bover-Arnal, T., Salas, R., Moreno-Bedmar, J.A., Bitzer, K., 2009, Sequence stratigraphy and architecture of a late Early–Middle Aptian carbonate platform succession from the western Maestrat Basin (Iberian Chain, Spain): Sedimentary Geology, 219(1-4), 280–301. https://doi.org/10.1016/j.sedgeo.2009.05.016
Burchette, T., Wright, V., 1992, Carbonate ramp depositional systems: Sedimentary Geology, 79(1-4), 3–57. https://doi.org/10.1016/0037-0738(92)90003-a
Catuneanu, O., Abreu, V., Bhattacharya, J.P., Blum, M.D., Dalrymple, R.W., Eriksson, P.G., Fielding, C.R., Fisher, W.L., Galloway, W.E., Gibling, M.R., Giles, K.A., Holbrook, J.M., Jordan, R., Kendall, C.G.St.C., Macurda, B., Martinsen, O.J., Miall, A.D., Neal, J.E., Nummedal, D., Pomar, L., Posamentier, H.W., Pratt, B.R., Sarg, J.F., Shanley, K.W., Steel, R.J., Strasser, A., Tucker, M.E., Winker, C., 2009, Towards the standardization of sequence stratigraphy: Earth-Science Reviews, 92(1-2), 1–33. https://doi.org/10.1016/j.earscirev.2008.10.003
Catuneanu, O., Galloway, W.E., Kendall, C.G.St.C., Miall, A.D., Posamentier, H.W., Strasser, A., Tucker, M.A., 2011, Sequence stratigraphy: Methodology and nomenclature: Newsletters on Stratigraphy, 44(3), 173–245. https://doi.org/10.1127/0078-0421/2011/0011
Corda, L., Brandano, M., 2003, Aphotic zone carbonate production on a Miocene ramp, Central Apennines, Italy: Sedimentary Geology, 161(1-2), 55–70. https://doi.org/10.1016/s0037-0738(02)00395-0
Cosovic, V., Drobne, K., Moro, A., 2004, Paleoenvironmental model for Eocene foraminiferal limestones of the Adriatic carbonate platform (Istrian Peninsula): Facies, 50(1), 61–75. https://doi.org/10.1007/s10347-004-0006-9
Davies, R.B., Casey, D.M., Horbury, A.D., Sharland, P.R., Simmons, M.D., 2002, Early to mid-Cretaceous mixed carbonate-siliciclastic shelfal systems: examples, issues and models from the Arabian plate: GeoArabia, 7, 541–598.
Dickson, J.A.D., 1966, Carbonate identification and genesis as revealed by staining: Journal of Sedimentary Research, 36, 441–505. https://doi.org/10.1306/74d714f6-2b21-11d7-8648000102c1865d
Dunham, R.J., 1962, Classification of carbonate rocks according to depositional texture, in Ham, W.E. (ed.), Classification of carbonate rocks: Tulsa, Oklahoma, U.S.A., American Association of Petroleum Geologists Memoir, 108–121.
Embry, A.F., Klovan, J.E., 1971, A late Devonian reef tract on northeastern Banks Island, NWT: Bulletin of Canadian Petroleum Geology, 19, 730–781.
Fakhari, M.D., Axen, G.J., Horton, B.K., Hassanzadeh, J., Amini, A., 2008, Revised age of proximal deposits in the Zagros foreland basin and implications for Cenozoic evolution of the High Zagros: Tectonophysics, 451(1-4), 170–185. https://doi.org/10.1016/j.tecto.2007.11.064
Flügel, E., 2010, Microfacies of Carbonate Rocks: Analysis, Interpretation and Application: Berlin, Heidelberg, New York, Springer-Verlag, 984 p. https://doi.org/10.1007/978-3-662-08726-8
Frakes, L.A., Francis, J.E., Syktus, J.I., 2005, Climate modes of the Phanerozoic: Cambridge, Cambridge University Press, 288 p. https://doi.org/10.1017/CBO9780511628948
Geel, T., 2000, Recognition of stratigraphic sequences in carbonate platform and slope deposits: empirical models based on microfacies analysis of Paleogene deposits in southeastern Spain: Palaeogeography, Palaeoclimatology, Palaeoecology, 155(3-4), 211–238. https://doi.org/10.1016/s0031-0182(99)00117-0
Ghabeishavi, A., Vaziri-Moghaddam, H., Taheri, A., Taati, F., 2010, Microfacies and depositional environment of the Cenomanian of the Bangestan Anticline, SW Iran: Journal of Asian Earth Sciences, 37(3), 275–285. https://doi.org/10.1016/j.jseaes.2009.08.014
Grabau, A.W., 1904, On the classification of sedimentary rocks: American Geologist, 33, 228–247.
Gradstein, F.M., Ogg, J.G., Smith, A.G., 2004, A Geologic Time Scale 2004: Cambridge, UK, Cambridge University Press, 589 p.
Grotsch, J., Billing, I., Vahrenkamp, V., 1998, Carbon-isotope stratigraphy in shallow-water carbonates: Implications for Cretaceous black-shale deposition: Sedimentology, 45(4), 623–634. https://doi.org/10.1046/j.1365-3091.1998.00158.x
Habibi, T., 2016, Bio- and sequence stratigraphy and microfacies analysis of the Oligocene Asmari Formation at Sepidar Anticline, Interior Fars sub-Basin, SW Iran: Historical Biology, 28(4), 519–532. https://doi.org/10.1080/08912963.2014.990388
Hamedanian, M.K., Vaziri, S.H., Amir Shakarami, M., Arian, M., Arzani, N., 2016, Microfacies, Sedimentary Environment and Sequence Stratigraphy of Gadvan and Darian Formations in the Zagros Basin, South of Semirom: Open Journal of Geology, 6, 1169–1186. http://dx.doi.org/10.4236/ojg.2016.69086
Haq, B.U., Al-Qahtani, A.B., 2005, Phanerozoic cycles of sea-level change on the Arabian Platform: GeoArabia, 10, 127–160.
Haq, B.U., Hardenbol, J., Vail, P.R., 1988, Mesozoic and Cenozoic chronostratigraphy and cycles of sea-level change: Society of Economic Paleontologists and Mineralogists Special Publication, 42, 71–108. https://doi.org/10.2110/pec.88.01.0071
Heimhofer, U., Hochuli, P.A., Burla, S., Weissert, H., 2007, New records of Early Cretaceous angiosperm pollen from Portuguese coastal deposits: implications for the timing of the early angiosperm radiation: Review of Palaeobotany and Palynology, 144(1-2), 39–76. https://doi.org/10.1016/j.revpalbo.2005.09.006
Heydari, E., 2008, Tectonics versus eustatic control on supersequences of the Zagros Mountains of Iran: Tectonophysics, 451(1-4), 56–70. https://doi.org/10.1016/j.tecto.2007.11.046
Huck, S., Rameil, N., Korbar, T., Heimhofer, U., Wieczorek, T.D., Immenhauser, A., 2010, Latitudinally different responses of Tethyan shoal‐water carbonate systems to the Early Aptian oceanic anoxic event (OAE 1a): Sedimentology, 57(7), 1585–1614. https://doi.org/10.1111/j.1365-3091.2010.01157.x
Huck, S., Heimhofer, U., Rameil, N., Bodin, S., Immenhauser, A., 2011, Strontium and carbon-isotope chronostratigraphy of Barremian–Aptian shoal-water carbonates: Northern Tethyan platform drowning predates OAE 1a: Earth and Planetary Science Letters, 304(3-4), 547–558. https://doi.org/10.1016/j.epsl.2011.02.031
Hughes, G., 2000, Saudi Arabian Late Jurassic and Early Cretaceous agglutinated foraminiferal associations and their application for age, palaeoenvironmental interpretation, sequence stratigraphy, and carbonate reservoir architecture: Grzybowski Foundation Special Publication, 7, 149–165.
Husinec, A., Velić, I., Fuček, L., Vlahović, I., Matičec, D., Oštrić, N., Korbar, T., 2000, Mid Cretaceous orbitolinid (Foraminiferida) record from the islands of Cres and Lošinj (Croatia) and its regional stratigraphic correlation: Cretaceous Research, 21(1), 155–171. https://doi.org/10.1006/cres.2000.0203
James, G., Wynd, J., 1965, Stratigraphic nomenclature of Iranian oil consortium agreement area: American Association of Petroleum Geologists Bulletin, 49, 2182–2245. https://doi.org/10.1306/a663388a-16c0-11d7-8645000102c1865d
Jenkyns, H.C., 2010, Geochemistry of oceanic anoxic events: Geochemistry, Geophysics, Geosystems, 11(3), Q03004. https://doi.org/10.1029/2009gc002788
Kargar, S.H., 2002, Geological Map of Saadat Shahr, scale: 1: 100000: Iran, Geological Survey of Iran.
Koop, W.J., Stoneley, R., 1982, Subsidence History of the Middle East Zagros Basin, Permian to Recent: Philosophical Transactions of the Royal Society of London, Series A, Mathematical and Physical Sciences, 305, 149–168. https://doi.org/10.1098/rsta.1982.0031
Leckie, R.M., Bralower, T.J., Cashman, R., 2002, Oceanic anoxic events and plankton evolution: Biotic response to tectonic forcing during the mid-Cretaceous: Paleoceanography, 17(3), 10–41. https://doi.org/10.1029/2001pa000623
Mancinelli, A., 2006, Acroporella cairensis n. sp. (Dasycladales) from the Barremian of Monte Cairo (southern Latium, Italy): Facies, 52(3), 411–416. https://doi.org/10.1007/s10347-006-0047-3
Mansouri-Daneshvar, P., Moussavi-Harami, R., Mahboubi, A., Gharaie, M.H.M., Feizie, A., 2015, Sequence stratigraphy of the petroliferous Dariyan Formation (Aptian) in Qeshm Island and offshore (southern Iran): Petroleum Science, 12(2), 232–251. https://doi.org/10.1007/s12182-015-0027-8
Martini, R., Cirilli, S., Saurer, C., Abate, B., Ferruzza, G., Lo Cicero, G., 2007, Depositional environment and biofacies characterization of the Triasic (Carnian to Rhaetian) carbonate succession of Punta Bassano (Marettimo Island, Sicily): Facies, 53(3), 389–400. https://doi.org/10.1007/s10347-007-0115-3
Masse, J.P., 1993, Valanginian–early Aptian carbonate platforms from Provence, southeastern France: American Association of Petroleum Geologists Memoir, 56, 363–374. https://doi.org/10.1306/M56578C29
Masse, J.P., Fenerci, M., Pernarcic, E., 2003, Palaeobathymetric reconstruction of peritidal carbonates: Late Barremian, Urgonian sequences of Provence (SE France): Palaeogeography, Palaeoclimatology, Palaeoecology, 200(1-4), 65–81. https://doi.org/10.1016/s0031-0182(03)00445-0
Maurer, F., Van Buchem, F.S.P., Eberli, G.P., Pierson, B.J., Raven, M.J., Larsen, P.H., Al-Husseini, M.I., Vincent, B., 2013, Late Aptian long-lived glacio-eustatic lowstand recorded on the Arabian Plate: Terra Nova, 25(2), 87–94. https://doi.org/10.1111/ter.12009
Mcllreath, I., James, N.P., 1984, Carbonate slopes, in Walker, R.G. (ed.), Facies Models, 2nd ed: Geoscience Canada Reprint Series, 1, 245–257.
McQuillin, H., 1974, Fahliyan Geological Compilation Map, Sheet No. 20842 W, scale 1: 100,000: Iran, Oil Survice Compony of Iran, Geological and Exploration Division.
Medvedev, A.L., Lopatin, A.Y., Masalkin, Y.V., 2011, Comparative characteristics of the lithological composition of the incised valley fill and host sediments of the Vikulovo Formation, Kamenny Area, West Siberia: Lithology and Mineral Resources, 46(4), 369–381. https://doi.org/10.1134/s0024490211040067
Mehay, S., Keller, C.E., Bernasconi, S.M., Weissert, H., Erba, E., Bottini, C., Hochuli, P.A., 2009, A volcanic CO2 pulse triggered the Cretaceous Oceanic Anoxic Event 1a and a biocalcification crisis: Geology, 37(9), 819–822. https://doi.org/10.1130/g30100a.1
Mehrabi, H., Rhimpour-Bonab, H., Hajikazemi, E., Esrafili-Dizaji, B., 2015, Geological reservoir characterization of the Lower Cretaceous Dariyan Formation (Shu’aiba equivalent) in the Persian Gulf, southern Iran: Marine and Petroleum Geology, 68(A), 132–157. https://doi.org/10.1016/j.marpetgeo.2015.08.014
Michalík, J., Soták, J., Lintnerová, O., Halásová, E., Bąk, M., Skupien, P., Boorová, D., 2008, The stratigraphic and paleoenvironmental setting of Aptian OAE black shale deposits in the Pieniny Klippen Belt, Slovak Western Carpathians: Cretaceous Research, 29(5-6), 871–892. https://doi.org/10.1016/j.cretres.2008.05.005
Moosavizadeh, M.A., Mahboubi, A., Moussavi-Harami, R., Kavoosi, M.A., 2014, Early Aptian oceanic anoxic event (OAE 1a) in Northeastern Arabian Plate setting: an example from Dariyan Formation in Zagros fold–trust belt, SE Iran: Arabian Journal of Geosciences, 7(11), 4745–4756. https://doi.org/10.1007/s12517-013-1025-z
Motiei, H., 1993, Treatise on the Geology of Iran 1, Stratigraphy of Zagros: Tehran, Iran, Geological Survey of Iran, 536 p, (in Farsi).
Naderi-Khujin, M., Seyrafian, A., Vaziri-Moghaddam, H., Tavakoli, V., 2016, A record of global change: OAE 1a in Dariyan shallow-water platform carbonates, southern Tethys, Persian Gulf, Iran: Facies, 62(4), 25. https://doi.org/10.1007/s10347-016-0476-6
Nankali, H.R., 2011, Slip rate of the Kazerun Fault and Main Recent Fault (Zagros, Iran) from 3D mechanical modelling: Journal of Asian Earth Sciences, 41(1), 89–98. https://doi.org/10.1016/j.jseaes.2010.12.009
Navabpour, P., Angelier, J., Barrier, E., 2010, Mesozoic extensional brittle tectonics of the Arabian passive margin, inverted in the Zagros collision (Iran, interior Fars), in Leturmy, P., Robin, C. (eds.), Tectonic and Stratigraphic Evolution of Zagros and Makran during the Mesozoic-Cenozoic: Geological Society, London, Special Publications, 330: 65–96.
Nichols, G., 2009, Sedimentology and Stratigraphy: Chichester, UK, Wiley–Blackwell, 419 p.
Nissen, E., Tatar, M., Jackson, J.A., Allen, M.B., 2011, New views on earthquake faulting in the Zagros fold-and-thrust belt of Iran: Geophysical Journal International, 186(3), 928-944. https://doi.org/10.1111/j.1365-246X.2011.05119.x
Palma, R.M., Lopez-Gomez, J., Piethe, R.D., 2007, Oxfordian ramp system (La Manga Formation) in the Bardas Blancas area (Mendoza Province) Neuquén Basin, Argentina: Facies and depositional sequences: Sedimentary Geology, 195(3-4), 113–134. https://doi.org/10.1016/j.sedgeo.2006.07.001
Payros, A., Pujalte, V., 2008, Calciclastic submarine fans: An integrated overview: Earth-Science Reviews, 86(1-4), 203–246. https://doi.org/10.1016/j.earscirev.2007.09.001
Payros, A., Pujalte, V., Tosquella, J., Orue-Etxebarria, X., 2010, The Eocene storm-dominated foralgal ramp of the western Pyrenees (Urbasa-Andia Formation): An analogue of future shallow-marine carbonate systems?: Sedimentary Geology, 228(3-4), 184–204. https://doi.org/10.1016/j.sedgeo.2010.04.010
Penney, S.J., Racey, A., 2004, Ecology of extant nummulitids and other larger benthic foraminifera: applications in palaeoenvironmental analysis: Earth-Science Reviews, 67(3-4), 219–265. https://doi.org/10.1016/j.earscirev.2004.02.005
Pérez-López, A., Pérez-Valera, F., 2012, Tempestite facies models for the epicontinental Triassic carbonates of the Betic Cordillera (southern Spain): Sedimentology, 59(2), 646–678. https://doi.org/10.1111/j.1365-3091.2011.01270.x
Piryaei, A., Reijmer, J., Borgomano, J., Van Buchem, F., 2011, Late Cretaceous tectonic and sedimentary evolution of the Bandar Abbas area, Fars region, southern Iran: Journal of Petroleum Geology, 34(2), 157–180. https://doi.org/10.1111/j.1747-5457.2011.00499.x
Pittet, B., Van Buchem, F.S.P., Hillgärtner, H., Razin, P., Grötsch, J., Droste, H., 2002, Ecological succession, palaeoenvironmental change, and depositional sequences of Barremian–Aptian shallow-water carbonates in northern Oman: Sedimentology, 49(3), 555–581. https://doi.org/10.1046/j.1365-3091.2002.00460.x
Pomar, L., 2001, Types of carbonate platforms: a genetic approach: Basin Research, 13(3), 313–334. https://doi.org/10.1046/j.0950-091x.2001.00152.x
Rahiminejad, A.H., Hassani, M.J., 2016a, Depositional environment of the Upper Cretaceous orbitolinid-rich microfacies in the Kuh-e Mazar anticline (Kerman Province, Central Iran): Historical Biology, 28(5), 597–612. https://doi.org/10.1080/08912963.2014.998667
Rahiminejad, A.H., Hassani, M.J., 2016b, Paleoenvironmental distribution patterns of orbitolinids in the Lower Cretaceous deposits of eastern Rafsanjan, Central Iran: Marine Micropaleontology, 122, 53–66. https://doi.org/10.1016/j.marmicro.2015.11.006
Rahiminejad, A.H., Zand-Moghadam, H., 2018, Synsedimentary formation of ooidal ironstone: an example from the Jurassic deposits of SE central Iran: Ore Geology Reviews, 95, 238–257. https://doi.org/10.1016/j.oregeorev.2018.02.028
Rahmani, O., Aali, J., Mohseni, H., Rahimpour-Bonab, H., Zalaghaie, S., 2010, Organic geochemistry of Gadvan and Kazhdumi formations (Cretaceous) in South Pars field, Persian Gulf, Iran: Journal of Petroleum Science and Engineering, 70(1-2), 57–66. https://doi.org/10.1016/j.petrol.2009.09.009
Rahiminejad, A.H., Yazdi, M., Ashouri, A.R., Kangazian, A., 2018, Siliciclastic input and sedimentation rate as controls on paleoecological distribution of Lower Miocene benthic carbonate producers in a fan–delta: Zagros foreland basin, Iran: Historical Biology, 30(5), 608–626. https://doi.org/10.1080/08912963.2017.1312360
Rameil, N., Immenhauser, A., Csoma, A.É., Warrlich, G., 2012, Surfaces with a long history: the Aptian top Shu’aiba Formation unconformity, Sultanate of Oman: Sedimentology, 59(1), 212–248. https://doi.org/10.1111/j.1365-3091.2011.01279.x
Raoufian, A., Zand-Moghadam, H., Seyed-Emami, K., 2019, Depositional history of Middle-Upper Jurassic succession at the Binalud mountains, NE Iran: implications of ammonite, trace fossil and stable isotopes in palaeoenvironmental analysis: Historical Biology, 1-18. https://doi.org/10.1080/08912963.2018.1563078
Read, J.F., 1985, Carbonate platform facies models: American Association of Petroleum Geologists Bulletin, 69, 1–21.
Renema, W., Troelstra, S., 2001, Larger foraminifera distribution on a mesotrophic carbonate shelf in SW Sulawesi (Indonesia): Palaeogeography, Palaeoclimatology, Palaeoecology, 175, 125–146. https://doi.org/10.1016/s0031-0182(01)00389-3
Rodríguez-López, J.P., Meléndez, N., De Boer, P.L., Soria, A.R., 2008, Aeolian sand sea development along the mid-Cretaceous western Tethyan margin (Spain): erg sedimentology and palaeoclimate implications: Sedimentology, 55(5), 1253–1292. https://doi.org/10.1111/j.1365-3091.2007.00945.x
Romero, J., Caus, E., Rosell, J., 2002, A model for the palaeoenvironmental distribution of larger foraminifera based on late Middle Eocene deposits on the margin of the South Pyrenean basin (NE Spain): Palaeogeography, Palaeoclimatology, Palaeoecology, 179(1-2), 43–56. https://doi.org/10.1016/s0031-0182(01)00406-0
Rubert, Y., Jati, M., Loisy, C., Cerepi, A., Foto, G., Muska, K., 2012, Sedimentology of resedimented carbonates: Facies and geometrical characterisation of an upper Cretaceous calciturbidite system in Albania: Sedimentary Geology, 257, 63–77. https://doi.org/10.1016/j.sedgeo.2012.02.009
Safaei, H., 2009, The continuation of the Kazerun fault system across the Sanandaj–irjan zone (Iran): Journal of Asian Earth Sciences, 35(5), 391–400. https://doi.org/10.1016/j.jseaes.2009.01.007
Sahagian, D., Pinous, O., Olferiev, A., Zakharov, V., 1996, Eustatic curve for the Middle Jurassic–Cretaceous based on Russian platform and Siberian stratigraphy: zonal resolution: American Association of Petroleum Geologists Bulletin, 80, 1433–1458. https://doi.org/10.1306/64ed9a56-1724-11d7-8645000102c1865d
Sandulli, R., Raspini, A., 2004, Regional to global correlation of lower Cretaceous (Hauterivian–Barremian) shallow-water carbonates of the southern Apennines (Italy) and Dinarides (Montenegro), Southern Tethyan Margin: Sedimentary Geology, 165(1-2), 117–153. https://doi.org/10.1016/j.sedgeo.2003.11.014
Schroeder, R., Van Buchem, F.S.P., Cherchi, A., Baghbani, D., Vincent, B., Immenhauser, A., Granier, B., 2010, Revised orbitolinid biostratigraphic zonation for the Barremian– Aptian of the eastern Arabian Plate and implications for regional stratigraphic correlations: GeoArabia, Special Publication, 4(1), 49–96.
Sepehr, M., Cosgrove, J.W., 2004, Structural framework of the Zagros Fold–Thrust Belt, Iran: Marine and Petroleum Geology, 21, 829–843.
Setudehnia, A., 1978, The Mesozoic sequence in south-west Iran and adjacent areas: Journal of Petroleum Geology, 1, 3–42. https://doi.org/10.1306/bf9ab591-0eb6-11d7-8643000102c1865d
Sedaghat, R., 1982, The sedimentology of the Upper Khami Group, Lower Cretaceous, in East Khuzestan, Southwest Iran: London, UK, University of London, Ph.D. thesis.
Sharland, P.R., Archer, R., Casey, D.M., Davies, R.B., Hall, S.H., Heward, A.P., Horbury, A.D., Simmons, M.D., 2001, Arabian Plate sequence stratigraphy: GeoArabia, Special Publication, 2, 371 p.
Skelton, P.W., Gili, E., 2012, Rudists and carbonate platforms in the Aptian: a case study on biotic interactions with ocean chemistry and climate: Sedimentology, 59(1), 81–117. https://doi.org/10.1111/j.1365-3091.2011.01292.x
Skelton, P.W., Spicer, R.A., Kelley, S.P., Gilmour, I., 2003, The Cretaceous world: New York, U.S.A., Cambridge University Press, 360 p.
Stein, M., Westermann, S., Adatte, T., Matera, V., Fleitmann, D., Spangenberg, J.E., Föllmi, KB., 2012, Late Barremiane Early Aptian palaeoenvironmental change: The Cassis-La Bédoule section, southeast France: Cretaceous Research, 37, 209–222. https://doi.org/10.1016/j.cretres.2012.03.021
Strasser, A., Samankassou, E., 2003, Carbonate Sedimentation Rates Today and in the Past: Holocene of Florida Bay, Bahamas, and Bermuda vs. Upper Jurassic and Lower Cretaceous of the Jura Mountains (Switzerland and France): Geologia Croatica, 56(1), 1–18.
Talbot, C.J., Alavi, M., 1996, The past of a future syntaxis across the Zagros: Geological Society, London, Special Publications, 100, 89-110.
Tavakoli, F., Walpersdorf, A., Authemayou, C., Nankali, H.R., Hatzfeld, D., Tatar, M., Djamour, Y., Nilforoushan, F., Cotte, N., 2008, Distribution of the right-lateral strike–slip motion from the Main Recent Fault to the Kazerun Fault System (Zagros, Iran): Evidence from present-day GPS velocities: Earth and Planetary Science Letters, 275(3-4), 342–347. https://doi.org/10.1016/j.epsl.2008.08.030
Van Buchem, F.S.P., Pittet, B., Hillgärtner, H., Grötsch, J., Al-Mansouri, A., Billing, I., Droste, H.J., Oterdoom, H., 2002, High-resolution Sequence-stratigraphic Architecture of Barremian/Aptian Carbonate Systems in northern Oman and the United Arab Emirates (Kharaib and Shuaiba Formations): GeoArabia, 7(3), 461–500.
Van Buchem, F.S.P., Baghbani, D., Bulot, L.G., Caron, M., Gaumet, F., Hosseini, S., Keyvani, F., Schroeder, R., Swennen, R., Vedrenne, V., Vincent, B., 2010, Barremian–Lower Albian sequence–stratigraphy of southwest Iran (Gadvan, Dariyan and Kazhdumi formations) and its comparison with Oman, Qatar and the United Arab Emirates, in Van Buchem, F.S.P., Al-Husseini, M.I., Maurer, F., Droste, H.J. (eds.), Barremian-Aptian Stratigraphy and Hydrocarbon Habitat of the Eastern Arabian Plate, Vol. 2: Gulf Petro Link, Bahrain, GeoArabia Special Publications 4, 503–548.
Vaziri-Moghaddam, H., Kimiagari, M., Taheri, A., 2006, Depositional environment and sequence stratigraphy of the Oligo-Miocene Asmari Formation in SW Iran: Facies, 52(1), 41–51. https://doi.org/10.1007/s10347-005-0018-0
Weissert, H., Erba, E., 2004, Volcanism, CO2 and palaeoclimate: a Late Jurassic–Early Cretaceous carbon and oxygen isotope record: Journal of the Geological Society, 161(4), 695–702. https://doi.org/10.1144/0016-764903-087
Wilmsen, M., Fürsich, F.T., Seyed-Emami, K., Majidifard, M.R., Zamani-Pedram, M., 2010, Facies analysis of a large-scale Jurassic shelf-lagoon: the Kamar-e-Mehdi Formation of east-central Iran: Facies, 56(1), 59-87. https://doi.org/10.1007/s10347-009-0190-8
Wilson, J.L., 1975, Carbonate Facies in Geologic History: Berlin, Heidelberg, New York, Springer–Verlag, 471 p.
Witt, W., Gökdag, H., 1994, Orbitolinid biostratigraphy of the Shu’aiba Formation (Aptian), Oman - implications for reservoir development, in Simmons, M.D. (ed.), Micropalaeontology and Hydrocarbon Exploration in the Middle East: London/New York, Chapman and Hall, 221–234.
Wynd, J.G., 1965, Biofacies of the Iranian oil consortium agreement area: Tehran, Iran, Iranian Oil Operating Companies, Geological and Exploration Division, Report No. 1082.
Yousefi, T., Kargar, S., 1999, Geological Compilation Map of Sivand, scale 1: 100000: Tehran, Iran, Geological Survey of Iran.
Ziegler, M.A., 2001, Late Permian to Holocene paleofacies evolution of the Arabian Plate and its hydrocarbon occurrences: GeoArabia, 6, 445–504.
Manuscript received: February 28, 2019
Corrected manuscript received: August 10, 2019
Manuscript accepted: September 03, 2019