
|
Boletín de la Sociedad Geológica Mexicana Volumen 73, núm. 2, A040121, 2021 |
 |
Geophysical characterization of a potentially active fault in the Agua Fría micro-graben, Los Azufres, Mexico
Caracterización geofísica de una falla potencialmente activa en el micrograben Agua Fría, Los Azufres, México
Jélime Cecilia Aray Castellano1,*, Pierre Lacan2, Víctor Hugo Garduño Monroy†, 3, Jesús Ávila García4, Joaquín Gómez Cortés3, Franck A. Audemard M.5, Octavio Lázaro Mancilla6, William Bandy7
1 Posgrado en Ciencias de la Tierra, Centro de Geociencias, Universidad Nacional Autónoma de México, Blvd. Juriquilla, 3001,76230, Querétaro, Mexico.
2 Centro de Geociencias, Universidad Nacional Autónoma de México, Blvd. Juriquilla, 3001, 76230, Juriquilla, Querétaro, Mexico.
3 Instituto de Investigaciones en Ciencias de la Tierra, Universidad Michoacana de San Nicolás de Hidalgo, Ciudad Universitaria, 58060, Morelia, Michoacán, Mexico.
4 Posgrado en Ciencias de la Tierra, Instituto de Geofísica, Universidad Nacional Autónoma de México, Circuito de la Investigación Científica, Ciudad Universitaria, Ciudad de México, 04510, Mexico.
5 Departamento de Geología, Universidad Central de Venezuela, Ciudad Universitaria, Los Chaguaramos, 1050, Caracas, Venezuela.
6 Laboratorio de Sismología y Geofísica Aplicada, Instituto de Ingeniería, Universidad Autónoma de Baja California. Blvd. Benito Juárez y Calle de la Normal S/N, Mexicali, B. C., 21280, Mexico.
7 Instituto de Geofísica, Universidad Nacional Autónoma de México, Circuito de la Investigación Científica, Ciudad Universitaria, Ciudad de México, 04510, Mexico.
* Corresponding author: (J.C. Aray Castellano)
This email address is being protected from spambots. You need JavaScript enabled to view it.
How to cite this article:
Aray Castellano, J.C., Lacan, P., Garduño Monroy, V.H., Ávila García, J., Gómez Cortés, J., Audemard M., F. A., Lázaro Mancilla, O., Bandy, W., 2021, Geophysical characterization of a potentially active fault in the Agua Fría micro-graben, Los Azufres, Mexico: Boletín de la Sociedad Geológica Mexicana, 73 (2), A040121. http://dx.doi.org/10.18268/BSGM2021v73n2a040121
ABSTRACT
In this study, three geophysical techniques were used to identify, localize, and characterize a partly blind fault in the Llano Grande basin within the Agua Fría Graben. This tectonic basin is located in the Los Azufres Volcanic Complex, one of the major silicic volcanic centers in the Trans-Mexican Volcanic Belt. The 1 km wide Agua Fría graben could be considered as an analogous of the larger graben structures bounded by the Morelia-Acambay Fault System. Since it is filled by recent sediments, it represents a challenge for the recognition and characterization of active faults that lack clear surface expression. Newly collected magnetic data led to the identification of lineaments interpreted as structural discontinuities. Ground penetrating radar and seismic refraction surveys were carried out across one of these magnetic lineaments crossing the basin to characterize the nature and geometry of the inferred discontinuity. The ground penetrating radar profiles allowed the identification of buried deformational structures interpreted as the northern segment of the Agua Fría fault. The subsurface reflectors displaced 1 to 1.5 m by the fault indicate that this structure is potentially active. The opening of trenches based on these results makes it possible to confirm the interpretation of the geophysical profiles, to discuss the precision of the data and to validate their use for such studies. On seismic refraction profiles, the deformation zones are related to low P-wave velocity zones. These geophysical studies demonstrate the potential of such techniques to locate faults in the subsurface, partially characterize the width of the fault zone and the associated displacement within the uppermost of the subsurface. Our results may be applied to define ideal sites for paleoseismic excavations which are essential for the identification and description of historical and prehistoric earthquakes, and thus, for the characterization of the local seismic hazard.
Keywords: Ground penetrating radar, seismic refraction, magnetic methods, active fault, paleoseismology, Morelia-Acambay fault system.
RESUMEN
En este estudio se emplearon tres técnicas geofísicas para identificar, localizar y caracterizar una falla parcialmente ciega en la cuenca de Llano Grande dentro del graben de Agua Fría. Esta cuenca tectónica se encuentra en el complejo volcánico Los Azufres, uno de los principales centros silícicos del Cinturón Volcánico Transmexicano. El graben de Agua Fría de 1 km de ancho, podría considerarse como análogo a las estructuras de graben más grandes delimitadas por el sistema de fallas Morelia-Acambay. Dado que está lleno de sedimentos recientes, presenta un desafío en cuanto a la identificación y caracterización de fallas activas que carecen de clara expresión superficial. Los datos magnéticos obtenidos para este trabajo nos permitieron identificar lineamientos interpretados como discontinuidades estructurales. Levantamientos con georadar y refracción sísmica se realizaron sobre uno de estos lineamientos magnéticos que cruzan la cuenca, para caracterizar la naturaleza y geometría de la discontinuidad inferida. Los perfiles de georadar permitieron la identificación de estructuras de deformación las cuales son interpretadas como el segmento norte de la falla Agua Fría. Los reflectores desplazados entre 1 y 1.5 m por la falla, indican que esta estructura es potencialmente activa. La apertura de trincheras con base en estos resultados confirma la interpretación de perfiles geofísicos y permite validar su precisión y su uso para este tipo de estudios. En los perfiles de refracción sísmica, las zonas de deformación están relacionadas con zonas de baja velocidad de ondas P. Estos estudios geofísicos demuestran la potencialidad de estas técnicas para localizar fallas en subsuelo a poca profundidad, caracterizar parcialmente el ancho de su zona de influencia y el desplazamiento asociado en los primeros metros del subsuelo. Nuestros resultados podrían ser aplicados para definir sitios ideales para excavaciones paleosísmicas que son esenciales para la identificación y descripción de terremotos históricos o prehistóricos y, por lo tanto, para la caracterización del peligro sísmico local.
Palabras clave: Georadar, sísmica de refracción, método magnético, fallas activas, paleosismología, sistema de fallas Morelia-Acambay.
- Introduction
The characterization of capable crustal faults for the evaluation of the seismic hazard implies knowledge of their cartographic length, their geometry and location. Thus, precise knowledge of these parameters is necessary for a reliable estimation of expected earthquakes and, consequently, a more reliable hazard analysis (e.g. Audemard and Singer, 1996; Audemard et al., 2000; Oldecop and Perucca, 2012). These parameters are usually evaluated using standard structural geology and geomorphology tools.
However, in some cases, all or part of the faults may be invisible on the surface due, for example, to high sedimentation or erosion rates (e.g. Nguyen et al., 2007; Pueyo Anchuela et al., 2016; Lacan and Arango-Galván, 2021).Such difficulties in identifying and characterizing the geometry of partly buried active faults are particularly true in the Trans Mexican Volcanic Belt (TMVB), an E-W volcanic arc that crosses central Mexico from the Pacific Ocean to the Gulf of Mexico (Figure 1A). Most of the TMVB is affected by intra-arc extension and is, therefore, cut by several normal fault systems. In the central part of the TMVB, the Morelia-Acambay fault system (MAFS) consists of close to a hundred active E-W to ENE-WSW normal faults, distributed over 200 km between the cities of Morelia and Acambay (Figure 1A; Suter et al., 1992, 1995, 2001; Garduño-Monroy et al., 2009; Mendoza-Ponce et al., 2018; Ortuño et al., 2019).
Historical and instrumental earthquake records provide evidence of activity of at least some faults of the MAFS (Suárez et al., 2019, 2020). The most emblematic historical earthquakes in this area are the 1912 Acambay (Ms 6.9; Urbina and Camacho, 1913; Suter et al., 1995; Langridge et al., 2000), the 1979 Maravatio earthquake (Mw 5.5; Astiz-Delgado, 1980; Rodríguez-Pérez and Zúñiga, 2017) and probably the 1858 St. Juliana earthquake (Figueroa, 1987; Suárez et al., 2019, 2020). Paleoseismological studies confirmed the Holocene activity of most of the faults of this system, obtaining recurrence intervals for large (M≥6) earthquakes of between 1,000 and 10,000 years along any given fault (Langridge et al., 2000, 2013; Sunye-Puchol et al., 2015; Ortuño et al., 2015, 2019; Suter, 2016; Lacan et al., 2018; Soria-Caballero et al., 2019). East of the MAFS, there is no geomorphic evidence of active faulting (Figure 1A). Nevertheless, the occurrence of the destructive 1920 Jalapa earthquake (Mw 6.4, Suárez, 1992; Suárez and Novelo-Casanova, 2018), as well as additional seismic events which took place in the eastern TMVB (Suter et al., 1996), represents clear indications that the region is tectonically active and the related seismic hazard has to be evaluated (Zúñiga et al., 2020).
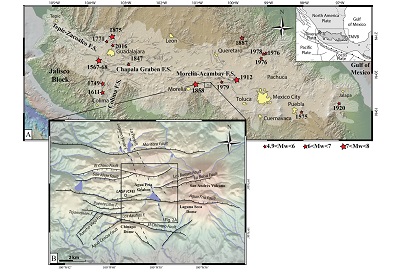 |
| Figure 1. (A) Seismotectonic and historical seismicity map of the Trans-Mexican Volcanic Belt (TMVB). Modified from Ferrari et al. (2012); Suárez et al. (2019); Suter (2019); Zúñiga et al. (2020). (B) Structural map of the Los Azufres Volcanic Field. LAGF= Los Azufres Geothermal Field (CFE Power plant). |
The MAFS defines a succession of grabens and half grabens partially filled with Pleistocene to Holocene sediments (e.g. Martínez-Reyes and Nieto-Samaniego, 1990). In the central part of the MAFS, the Los Azufres volcanic field is crossed by different faults which form the small Agua Fría graben (Dobson and Mahood, 1985; Ferrari et al., 1991; Pradal and Robin, 1994) within which the Los Azufres geothermal power plant is located (LAGF; Figure 1B). This 1 km wide graben represents a good analogous of the larger-scale structures that form the MAFS. In this area, several tectonic structures have been identified based on structural geology and geomorphic studies (e.g. Camacho, 1976; De La Cruz et al., 1983; Ferrari et al., 1991; Pérez-Esquivias et al., 2010). For the past three years, our group has been focusing on the neotectonic study of the Agua Fría fault, the longest of the tectonic structures identified in the Los Azufres volcanic Field, and the evaluation of the related seismic hazard. To do so, detailed structural and geomorphological mapping was carried out along this fault and the northern segment of the Agua Fría fault was identified (Campos Medina, 2018). To specify its location and estimate its extension in the sedimentary filling of the Agua Fría Graben, where the fault does not present any topographical expression, geophysical subsurface prospecting was necessary.
In this context, the main purpose of this work is to identify, locate, and characterize the geometry of the partially blind and potentially active northern segment of the Agua Fría fault. To reach this main goal, a combination of non-invasive geophysical tools such as total magnetic field, ground penetrating radar (GPR), and seismic refraction are used to image a potentially active structure in the Llano Grande Basin (Figure 1B). Preliminary results have been used to identify paleoseismic excavation sites studied by Campos Medina (2018). These new paleoseismic results are used in the discussion of the present study to validate the interpretations of geophysical results.
In detail, the total magnetic field anomaly data are used to detect and map the main structural domains and the potential structural lineaments that separate them. Detailed high-resolution GPR profiles across one of these magnetic lineaments lead to image reflectors offsets and interpret the lineament as a capable fault and locate trenching sites. Furthermore, the seismic refraction allows for the determination of lateral and vertical velocity variations associated with the magnetically identified tectonic structure, and also to image the fault zone at depth.
- Geological framework
The TMVB is a Late Miocene to Holocene volcanic arc, which crosses Mexico from west to east (Ferrari, 2000 and references inside). It is intersected by several fault systems that have been partially reactivated at different times during its evolution (Ferrari et al., 2012 and references inside). The intra-arc Neogene deformation in the TMVB consists of extensional fault systems delimiting rift valleys, filled by volcanic materials and fluvio-lacustrine sediments (Johnson and Harrison, 1990; Ferrari et al., 2012). In the central part of the TMVB, the E-W active MAFS intersects NNE-SSW to NNW-SSE-trending Basin-and-Range extensional structures (Pasquarè et al., 1988; Ferrari et al., 1991).
The persistent activity of the MAFS has been demonstrated by the occurrence of historical earthquakes (Suárez et al., 2019), structural data (Suter et al., 2001), and paleoseismological studies that additionally characterize their seismogenic potential (Lacan et al., 2018 and references inside). Unfortunately, only few geophysical studies have been conducted to evaluate the geometry of the faults at depth and their relationships (e.g. Arzate et al., 2018).
Los Azufres Volcanic Complex (LAVC) in the State of Michoacán is located along and dissected by the MAFS. The E-W faults of the MAFS affect the topography of the volcanic edifice (Arce et al., 2012). Their mapping was set out at different scales for the needs of geothermal studies (Camacho, 1976; Dobson and Mahood, 1985; Ferrari et al., 1991; Pradal and Robin, 1994; Suter et al., 2001). However, their precise mapping and characterization for seismic hazard assessment started with our group three years ago (Campos Medina, 2018).The LAVC covers 676 km2. Its chemical composition is predominantly rhyolitic to dacitic, although some basaltic and andesitic products have been described (e.g. Ferrari et al., 1991; Macías et al., 2008; Figure 2A).
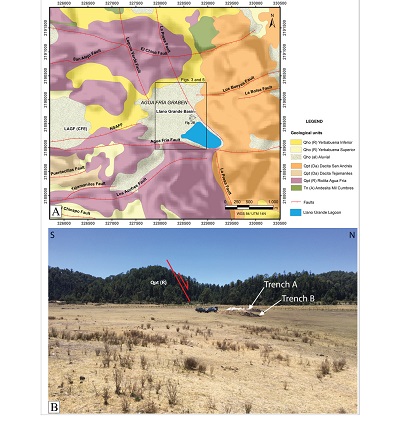 |
| Figure 2. (A) Geological map of the Agua Fría Graben showing the main geological units and fault traces. (B) Picture illustrating the morphological expression of the NSAFF on the rhyolitic basement and in the Llano Grande basin. The location of Campos Medina (2018) trenches A and B is shown. The black box indicates the magnetic studies area. LAGF= Los Azufres Geothermal Field (CFE Power plant), NSAFF= Northern segment of the Agua Fría Fault (modified from De La Cruz et al., 1983 and Campos Medina, 2018). |
The study area is a sedimentary basin called Llano Grande. It is located within the LAVC. This zone lies between 100° and 101° W, in the vicinity of LAGF which is 2850 masl. This area is approximately 100 km east of Morelia, within the small Agua Fría graben (Figures 1 and 2). The Agua Fría Graben is bounded by two faults of the MAFS: the Agua Fría fault (to the south) and the El Chino fault (to the north) and define the sedimentary basin of Llano Grande (Figure 2A). Locally, these active faults intersect with the older NNW-SSE Laguna Verde and N-S La Presa faults. These latter have been identified by structural geology and geophysical studies, but show little or no morphological expression (De La Cruz et al., 1983; Dobson and Mahood, 1985; Campos-Enríquez and Garduño-Monroy, 1995; Pérez-Esquivias et al., 2010). The bottom of the Llano Grande basin is partially covered by a dam lake to the south-east. The emerging part of the sedimentary filling (in the northwest) presents a relatively flat surface, chiseled by numerous topographic escarpments, mainly caused by the erosion of torrential streams. In this context, possible micro-topographic signals related to recent faulting are masked by the roughness of the ground (Figure 2B).
- Methodology
3.1. TOTAL FIELD MAGNETIC DATA
Non-invasive magnetics methods are often appropriate for locating blind structures (e.g. Glen et al., 2008). During the last five decades, a variety of methods based on vertical and horizontal gradients of magnetic potential-field anomalies have been developed and implemented for the determination of geologic boundaries, such as lithological contacts and faults, hence these methods are also valuable for the exploration of geothermal resources (Nabighian, 1972, 1974; Keating and Pilkington, 1990; Ferreira et al., 2013; Mazzoldi et al., 2020). At the studied site, a regular mesh was designed to acquire total field magnetic data using a Geometrics G-857 proton-precession magnetometer, connected with 2 m of horizontal resolution Garmin Oregon 450 GPS. Thirteen 1320 m-long N-S oriented profiles (in-lines) and five 1150 m-long orthogonal profiles (cross-lines) were surveyed. The spacing between stations was 25 m on each line (Figure 3), for a total of 583 field magnetic measurements.
The total field magnetic data have been corrected for diurnal variations using values of the Magnetic Observatory of Teoloyucan. The regional component of the Earth’s Magnetic Field (IGRF) has been removed to obtain the local anomaly.
To generate the final residual magnetic field map (RMF map) we have applied an Upward Continuation (UC) filter, which is essentially low pass in the frequency domain, to filter out the contributions of shallow sources (e.g. Gianiyu et al., 2013; Ferreira et al., 2013). Subsequently, a Reduced-to-Pole (RTP) map has been calculated by applying an RTP filter to the RMF data using a site magnetic Inclination and Declination of 47.27° and 5.22°, respectively. The RTP filter is used to deskew the anomaly, obtaining an anomaly that would have been observed if the Earth’s magnetic pole had been located at the measurement site. The processing methodology from Mazzoldi et al. (2020) has been used to obtain the magnetic anomaly. A spectral analysis was carried out on the RMF data to estimate the depths of the source bodies.
For this analysis, the magnetic data were transformed from the spatial domain to the frequency domain using the MAGMAP module of Geosoft’s Oasis Montaj software. Several authors (e.g. Garcia and Ness, 1994; Tatiana and Angelo, 1998, among others) explained the spectral analysis technique. It is based on the analysis of the magnetic data using Fourier Transform on the spectral analysis map and its computer conjugate (Araffa et al., 2017).
The horizontal derivative maps in both X and Y directions were generated from the RTP data.These maps emphasize the source effects, reducing the interference effects of the anomalies and yield an enhanced image of the boundaries (e.g. Skrame et al., 2016). For its part, the vertical derivative was mathematically determined from the total field magnetic anomaly map to highlight the locations of faults and contact features. The first vertical derivative represents a sharper resolution of near-surface features (Araffa et al., 2019).
3.2. THE 2D GPR SURVEY
Since the use of GPR is a classical technique to image buried structures, only a short overview of the GPR methodology is presented here. For a more complete description of the basics of GPR see Davis and Annan (1989), Neal (2004), among others. The technique is based on the measurements of the subsurface echoes of the transmitted high-frequency electromagnetic waves (EM; typically 16 MHz–1000 GHz). A transmitting antenna on the ground surface emits EM waves in distinct pulses that propagate into the ground and reflect or diffract at interfaces where the dielectric permittivity of the subsurface changes (Davis and Annan, 1989; Daniels, 2000; Jol and Bristow, 2003). EM wave velocity data allow the conversion of a time record of reflections to an estimated depth record (Gómez-Ortiz et al., 2007).
In paleoseismology, the use of GPR as a tool to detect and analyze the nature and architecture of active or Quaternary fault zones and faults in shallow subsurface is well known (e.g. Demanet et al., 2001; Rashed et al., 2003; Audemard et al., 2006; Christie et al., 2009; Pauselli et al., 2010; Wallace et al., 2010; Lacan et al., 2012; Cinti et al., 2015; Hermana et al., 2019; Gunda et al., 2020). The GPR profiles provide high-resolution images of shallow stratigraphy and subsurface fault zones which lack clear surface expressions. Hence, such profiles facilitate the identification, mapping, and characterization of the area affected by blind tectonic structures (Gunda et al., 2020).
The signal/noise ratio of GPR data is high when the permittivity contrast between the units displaced by the fault is significant because of the abrupt change in the electrical property of the material (Joshi et al., 2012). In the study area, the subsurface consists of intercalations of fluvio-lacustrine and volcanic units which could be represented by visible changes in the pattern of the reflectors. The 2D profiles were surveyed using a MALA GPR instrument equipped with 250 MHz and 100 MHz shielded antennas to achieve results with an ideal balance between penetration depth and vertical resolution. Profile lengths have been measured using an electro-mechanic odometer incorporated in the equipment. Topographic profiling was carried out with a GeoMax ZAL 132 instrument. We applied a basic processing sequence to the measured data, using the Reflex v.3 software (developed by Sandmeier, 2016), with common consistent steps such as drift removal (i.e. zero time correction), dewow filter, bandpass filter, background removal, topographic correction, depth control, etc. (e.g. Malik and Mohanty, 2007; Xavier and Gibson, 2011; Ercoli et al., 2013; Robinson et al., 2013). The average velocity of 0.11 m/ns was calculated using the velocity analysis tool in Reflex.
3.3. SEISMIC REFRACTION
The seismic refraction method is a useful tool to determine depths to subsurface interfaces and the velocities of the layer between them (Lillie, 1999). It illustrates P-wave or S-wave velocity variations of the subsurface and, in turn, this method allows for the interpretation of structural or stratigraphic discontinuities. Also, seismic refraction is commonly used in engineering, mining, groundwater, environmental or geothermal exploration (e.g. Shah et al., 2015; Brixová et al., 2018). Several investigations have also combined seismic refraction with other geophysical techniques (commonly Downhole geophysics, electrical and EM profiling) to recognize active fault zones and precisely locate trenching sites for seismic hazard assessment (e.g. Demanet et al., 2001; Terzic et al., 2017, 2019; Blecha et al., 2018).
The seismic refraction data at the Llano Grande basin have been acquired across the main anomalies identified with the magnetic study. The data were obtained using a GEOMETRICS, 24-channel, GEODE seismometer, with 4.5 Hz vertical geophones spaced 5 m apart. In most of the study, the controlled source used to generate acoustic waves was a 200 kg free-fall seismic source but in some less accessible sites, an 8 kg hammer was used. The source points were placed every 60 m on each 120 m long profile (at 0 m, 60 m, and 120 m). Each seismic section has a maximum recording time of 0.5 s and all seismic records were acquired with a sampling rate of 4,000 samples/s.
The arrivals of each seismic wave generated by the source are detected by the set of geophones. For each source point, a seismic section (from SEG-2 data format) was obtained using the Reflex v.3 software. The first arrivals of the seismic wave were picked for each geophone on the seismic section. For each profile, we integrated the arrival times interpreted on the seismic sections. We established a 2-3 layers initial model for each profile with their respective vertical velocity variations. Free software RAYINVR by Zelt and Smith (1992) was used to perform the forward modeling technique. This technique allows fitting the arrivals times calculated by the model to the first arrivals interpreted in each profile, therefore, a P-wave velocity model was obtained. Such a model was used to identify the P-wave vertical and lateral velocity variations which we relate with structural or lithological variations in the subsurface.
- Results
4.1. TOTAL FIELD MAGNETIC DATA
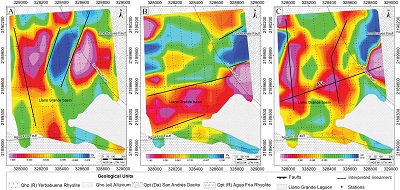
The RMF map (Figure 3A) and the RTP map (Figure 3B) show almost the same anomaly distribution with only a slight northward shift of the anomaly B. The magnitude of this anomaly increases both in its areal extent and its vertical relief. In the following, we will focus on describing the results obtained on the RTP map considering its precision in the direct interpretation of the magnetic sources.
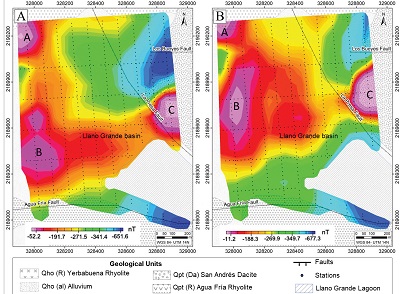 |
| Figure 3. Magnetic anomaly maps of the Llano Grande basin, (A) Residual magnetic field map (RMF map), (B) Reduction to the pole map (RTP map). A, B and C letters inside maps correspond to identified magnetic anomalies. |
The analysis of the RTP magnetic anomaly (Figure 3B) indicates that the magnetic field in the area has a maximum amplitude of about -11 nT to the northwest and the east of the studied area (A, B, and C in Figure 3B) and minimum amplitude of about -670 nT to the south and the northeast. The most important magnetic trends show two main orientations. One, in an ENE-WSW direction, in the central part of the study area, is more or less parallel to the Agua Fría fault and a second, in a NW-SE direction, is parallel to the Laguna Verde fault.
The radially averaged power spectrum (Figure 4) illustrates the estimated average depth levels of magnetic sources prevailing in the study area. This averaged power spectrum indicates that the deeper source is about 150 m and the shallower is about 62 m depth.
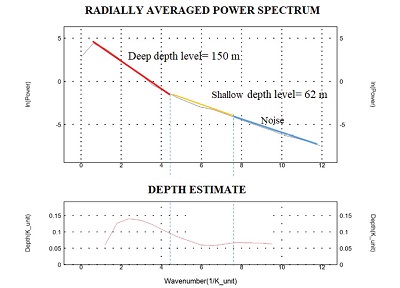 |
| Figure 4. 2-D radially averaged power spectrum for the magnetic data. |
The horizontal derivative maps in both X and Y directions are shown in Figure 5A and 5B). The map of the first horizontal derivative in the X-direction (Figure 5A) reveals that the trends dominating the Llano Grande area are oriented NNW-SSE and NNE–SSW. On the other hand, the map of the first horizontal derivative in the Y-direction (Figure 5B) shows that the most dominant trends are ENE -WSW. The vertical derivative map (Figure 5C) highlighted the edges of the magnetized structures and it reduced the complexity of anomalies observed in the horizontal derivative maps. The main magnetic lineaments in this map trend N-S and NE–SW.
 |
| Figure 5. Main interpreted lineaments over the processed magnetic anomaly maps. (A) First horizontal derivative of RTP map in X-direction, (B) first horizontal derivative of RTP map in Y-direction, (C) first vertical derivative of RTP map in Z-direction (FZD). AFL= Agua Fría Lineament. |
In this study, we have selected the central magnetic lineament of the basin which we call Agua Fría Lineament (AFL; Figure 5C), to be analyzed by the 2-D profiles. We use this nomenclature based on the fact that this magnetic lineament which extends from the west to the east side of the maps (Figures 5B and 5C), could be the blind extension of the northern segment of the Agua Fría fault mapped from its topographic escarpment between the CFE power plant (LAGF) and the Llano Grande basin (Figure 2A). This fault is suspected to be active by considering its morphology and orientation so its neotectonic study is challenging for the evaluation of seismic hazard.
4.2. THE 2D GPR SURVEY
Two sub-parallel GPR profiles have been surveyed across the ENE-WSW main magnetic lineament previously identified (Figure 6). By considering an average velocity of electromagnetic waves of 0.1 m/ns to unconsolidated alluvial materials (Annan, 2001; Jol and Bristow, 2003), the penetration depth is about 5 m on average for the 100 MHz antennas.
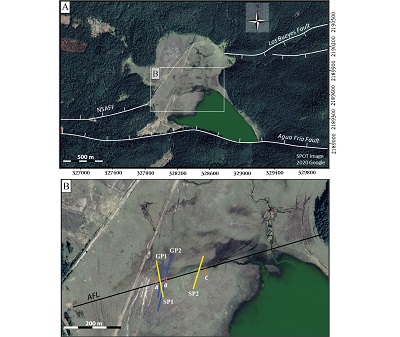 |
| Figure 6. Aerial photographs of the Llano Grande basin showing (A) the location of known crustal faults (NSAFF= Northern Segment of Agua Fría Fault) and, (B) the location of the Agua Fría Lineament (solid black line), the GPR and seismic profiles and Campos Medina (2018) trenches. Yellow lines= Seismic profiles, blue lines= GPR profiles, orange boxes= trenches (labeled A, B, C). |
In the profile GP1, three zones can be identified based on the reflection pattern in the processed and un-interpreted radargram (Figure 7A). The upper zone, located between 0 and 20 ns (Z1; Figure 7B), is characterized by high reflectivity, sub-horizontal signals of about 0.5 m thick. These layers lie over a high-attenuation intermediate unit (about 1 m thick), characterized by a chaotic reflectivity pattern and by gentle NE-dipping layers (Z2; Figure 7B). At the bottom, the third zone is characterized by hyperbolic diffractions describing a group of NE-dipping reflectors (Z3; Figure 7B).Between 40-60 m along the profile GP1, a series of reflector discontinuities are indicated with red continuous and segmented lines that cross sub-vertically all the reflector sequences in the record GP1 (Figure 7B). The discontinuities describe a 1 m vertical offset of the sequences.
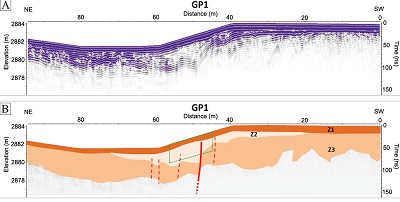 |
| Figure 7. GPR profile GP1 acquired using 100 MHz antennas across the Agua Fría Lineament. (A) Processed and un-interpreted profile, (B) processed and interpreted profile. Green dotted lines box shows the lateral projection of the 3A trench of Campos Medina (2018) on the GPR profile. The different colors represent changes in the electromagnetic response. Z1, Z2 and Z3 refer to the three zones described in the text.(Vertical Exaggeration= ~2.4x). |
Similar to that described for GP1, the high resolution obtained for the profile GP2 allows defining three main zones based on reflection pattern in the processed and un-interpreted profile (Figure 8A). The first two upper zones are very similar to those described in profile GP1 (Z1; Figure 8B).
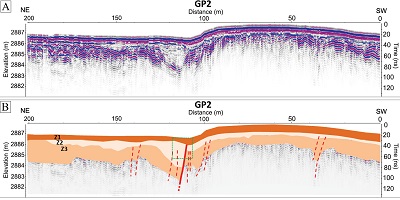 |
| Figure 8. GPR profile GP2 acquired using 100 MHz antennas across the Agua Fría Lineamentt. (A) Processed and un-interpreted profile, (B) processed and interpreted profile. Green dotted lines box shows the lateral projection of the 3B trench of Campos Medina (2018) on the GPR profile. The different colors represent changes in the electromagnetic response. Z1, Z2, Z3 refer to the three zones described in the text. (Vertical Exaggeration= ~6x). |
On the other hand, in the third zone, a fold-type reflector sequence is observed in the record (Z3; Figure 8B). This reflection pattern is different from those flat-type reflector sequences observed in the third zone of the profile GP1 (Z3; Figure 7B). In the record GP2, red continuous and segmented lines indicate the reflector discontinuities that cross sub-vertically all the reflector sequences (Figure 8B). At about 110 m along the profile, distorted radar reflectors exhibit an almost 1.5 m vertical offset.
4.3. SEISMIC REFRACTION
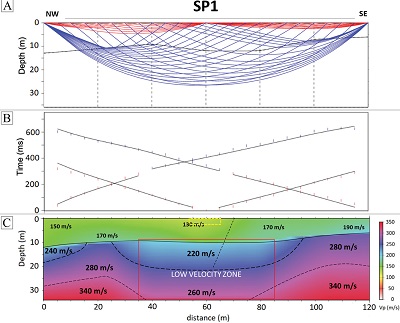
Two 120 m long seismic refraction profiles, SP1 and SP2, were surveyed on the AFL, approximately parallel to the GPR profiles (Figure 6). Profile SP1 has a NW-SE orientation, perpendicular to the magnetic lineament. SP1 ray-tracing model are shown in Figure 9A. The first arrivals, picked from seismic sections fitting the calculated travel times from forward modeling is shown in Figure 9B. Profile SP1 shows a gradual vertical increase in the P-wave velocity from approximately 130 m/s at the top to 340m/s at the bottom (Figure 9C).
 |
|
Figure 9. Seismic velocity model obtained for the profile SP1. (A) Ray-tracing model, (B) time arrivals from seismic section (vertical colored dashes) and calculated times from forward modeling (solid black lines), (C) Interpolated color-scaled velocity model. Dotted lines show abrupt lateral velocity change and the low-velocity area in the center of the profile is highlighted with a red rectangle. Yellow dotted lines box= lateral projection of the 3A trench of Campos Medina (2018) on the seismic profile. (No vertical exaggeration). |
Abrupt P-wave variations between 40-60 m/s are indicated with black segmented lines. A low-velocity zone is visible between 35 and 85 m along the profile which extends to depths of up to 35 m (red box; Figure 9C). Profile SP2 has a NE-SW orientation and has also been surveyed crossing the AFL (Figures 6). SP2 ray-tracing model is shown in Figure 10A. The first arrivals, picked from seismic sections fitting the calculated travel times from forward modeling are shown in Figure 10B. A gradual vertical increase in the P-wave velocity is visible from minimum velocities of 100 m/s (top NE side of the profile) to 290 m/s. The velocities obtained for this profile are lower than those observed in SP1. Velocity variations of at least 40 m/s are indicated with black segmented lines. Two abrupt lateral velocity variations (black segmented inclined lines) are observed at approximately 15 and 50 m along the profile in the upper sequences. In profile SP2, the lowest velocities are visible in the northeastern part of the profile. Lastly, a low-velocity zone that deepens below 10 m is indicated with a red box at a distance between 0 and 15 m along the profile (Figure 10C).
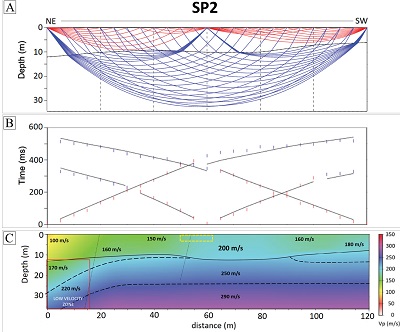 |
| Figure 10. Seismic velocity model obtained for the profile SP2. (A) Ray-tracing model, (B) Time arrivals from seismic section (vertical colored dashes) and calculated times from forward modeling (solid black lines), (C) Interpolated color-scaled velocity model. Dotted lines show abrupt lateral velocity change and the low-velocity area in the center of the profile is highlighted with a red rectangle. Yellow dotted lines box= lateral projection of the 3C trench of Campos Medina (2018) on the seismic profile. (No vertical exaggeration). |
- Discussion
For the evaluation of the seismic hazard, obtaining parameters such as the cartographic length of the faults, their geometry and the width of the fault zone is crucial. During the past decades, the faults bordering the Agua Fría graben have been described and mapped by structural analysis or photo interpretation (e.g. De la Cruz et al., 1983; Dobson and Mahood, 1985; Garduño-Monroy, 1987). However, the presence of faults within the micro-graben, less visible in morphology, was poorly constrained and therefore was not reported or was imprecisely mapped. In particular, the northern segment of the Agua Fría fault had never been mapped before our group identified it for the first time and determined with this study its possible continuity in the sedimentary filling of the Llano Grande basin that could neither be demonstrated nor discarded from classical geological observations.
The magnetic anomalies exhibit a high and low amplitude related to volcanic rocks (basement) and sediments, respectively. In general, the results of the interpretation of the magnetic anomaly maps correlate well with the known local geological contacts, faults, and structures (see Figures 2, 3, and 5). The anomaly A, identified in both the RMF and RTP maps (Figure 3), could be associated with the strongly magnetized volcanic rocks present in the La Yerbabuena Rhyolitic unit (Dobson and Mahood, 1985; Macías et al., 2008). In the same way, the anomaly C could correspond to the magnetic signature of the volcanic rocks forming the San Andrés dacitic dome (Dobson and Mahood, 1985). Combinations of directional derivatives of the magnetic data surveyed over the Llano Grande basin (Figure 5) allowed the identification of potentially important structures which cross the basement of the Llano Grande basin. Some solutions indicate the presence of lineaments that are possibly related to buried NE-SW and NNW-SSE faults. Although anomalies A and B are parallel to the NNW-SSE La Presa fault they would represent the southern prolongation of the Laguna Verde fault under the alluvial deposit. The alignment formed by anomalies B and C would correspond to the upthrown block of the Laguna Verde fault where structural highs of the Rhyolite may be buried. These structures are associated with the Basin and Range tectonic provinces and have been documented and referred to the eastern limit of the producing area of the geothermal field (e.g. De La Cruz et al., 1983; Dobson and Mahood, 1985; Garduño-Monroy et al., 1987; López-Hernández, 1991). Gradients with ENE-WSW and E-W orientation could correspond to faults accommodating the current N-S extension in the TMVB, similar to that reported by Campos-Enríquez and Garduño-Monroy (1995) in their regional study. We then focused our GPR and seismic refraction studies on the clearest WSW-ENE lineament called herein the AFL. This magnetic lineament crosses the entire study area and most likely corresponds to one of the potentially active faults intersecting the Los Azufres volcanic edifice (Figure 6).
Regarding the GPR data, the most apparent features in the two profiles are the diffraction hyperbolas and layer truncations. These are related with strong lateral contrast in permittivity across each material and are consistent with the presence of a fault or other geologic structures affecting the basement, as already previously highlighted in the literature (e.g. Busby and Merritt, 1999; Bano et al., 2002; Pauselli et al., 2010; Ercoli et al., 2013).
The two GPR profiles show reflector discontinuities which allow interpreting the AFL as a north-dipping normal fault displacing relatively shallow and therefore potentially recent sedimentary units (Figures 7 and 8). Inclined and distorted radar reflectors between 0.5 and 4 m depth indicate a deformation by 1 m to 1.5 m between the two blocks. Exploratory results of this study allowed the location of paleoseismic excavations reported preliminarily in the Master thesis of Campos Medina (2018). Three trenches were dug perpendicular to the fault and two of them are almost located on the axis of the radar profiles (location in Figure 6B; Campos Medina, 2018). The two trenches show an offset of the sedimentary units along a north-dipping fault which varies between 1.48 and 1.80 m in total. This deformation is distributed over a more or less wide fault zone. Trench A shows a very localized fault zone with a single north-dipping fault which accommodates all the displacement on one wall and a slightly more complicated fault zone on the other wall (two north-dipping synthetic faults and one south-dipping antithetic fault). For trench B, the fault zone is more complex and in the trench, only a fault propagation fold is visible accommodating the tectonic deformation over a 5 meters wide area. The fault zone is not visible in the trench which only exposes the first 2 m of the subsurface. The analysis of these trenches shows the reliability of the GPR for imaging such structures, both to locate them precisely in a landscape without clear morphological expression and to estimate the geometry, displacement and width of the fault zone which are of the same order of magnitude on the GPR profile and in the trenches.
The low-velocity zone identified in the seismic profile SP1 (Figure 9) corresponds geographically with the location of the fault previously highlighted by the GPR. In the profile SP2 (Figure 10), the abrupt lateral velocity variation at 50 m along the profile corresponds with the location of the AFL, while the lateral velocity variation at 15 m along the profile seems to correspond with the location of a gully identified by field observations. The low-velocity zone and the abrupt velocity variation in the seismic profiles are related to the variation of acoustic properties of materials, and it could correspond to altered rocks by fluid circulation along and in the vicinity of the fault plane as suggested by some authors (e.g. Pellerin and Christensen et al., 1998; Yan et al., 2005).
Figure 11 presents an overlay of the two GPR profiles (GP1 and GP2) with magnified views (up to 10 m depth) of the SP1 and SP2. This figure shows a strong correlation between both data sets and can be used to image and characterize the lineament highlighted in the magnetic maps and then to interpret it as a north-dipping normal fault displacing relatively shallow sedimentary units. The offset (vertical displacement) is about 20 ns in the radargrams. Using 0.1 m/ns velocity to time-depth conversion, give us an average vertical displacement of 1 to 1.5 m between reflectors with the same electromagnetic properties. Such displacement is compatible with the paleoseismic observations preliminary reported by Campos Medina (2018).
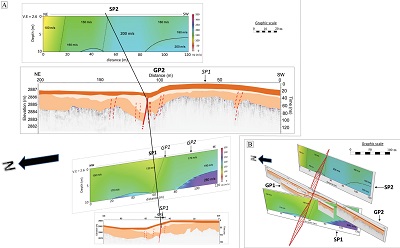 |
| Figure 11. Correlation of interpreted GPR records and magnified views up to 10 m depth of the seismic refraction profiles SP1 and SP2. (A) Plan view of interpreted GPR and seismic profiles at the same horizontal scale. The black line indicates the interpreted fault trace. (B) 3D view showing the relative distance between profiles according to the graphic scale. The red polygon indicates the estimated fault plane of the northern segment of the Agua Fría fault. |
Considering the location and the northward dip of the fault, we assume that this structure corresponds to the eastern prolongation of the northern segment of the Agua Fría fault (NSAFF) preserved in the morphology of the rhyolitic formations between LAGF and the Llano Grande basin as shown in Figure 12. Considering the surface sedimentation in the Llano Grande active basin, such deformation could be Holocene and according to the criteria proposed by Audemard (2003, 2005), this site was suitable and therefore the object of paleoseismological study which confirmed our preliminary interpretations (Campos Medina, 2018).
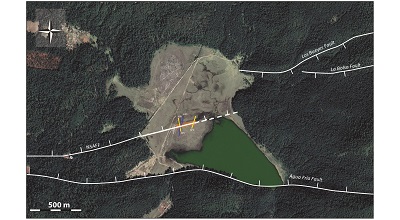 |
| Figure 12. Aerial photographs of the Llano Grande basin showing the eastern continuity of the northern segment of the Agua Fría fault identified through the integration of geophysical data. Orange box indicates the width of the fault zone. |
- Conclusions
Three complementary shallow geophysical techniques were used to image the structures affecting the basement of the Llano Grande basin in the Los Azufres volcanic field. The Total Field Magnetic data led us to identify anomalies and lineaments of different orientations. The GPR and seismic refraction techniques allowed us to structurally characterize the main magnetic lineament identified in the basin and to interpret it as a high angle north-dipping normal fault. The good resolution GPR data show inclined, distorted and displaced reflectors between 0.5 and 4 m depth allowing estimating the offset of the more superficial deposits in about 1-1.5 m. The GPR data, in this context, allow: 1) precisely locating the fault zone, 2) estimating the offset of the displaced sequences. In turn, the seismic refraction results indicate that the deformation extends in depth to more than 10 m and the horizontal width of the disrupted area associated with the fault is about 40 m but it increases with depth.
This fault is interpreted as the eastern prolongation of the northern segment of the Agua Fría fault hidden under the sedimentary cover of the Llano Grande basin. In this area, the GPR technique is the most effective to illuminate and characterize the fault zone. However, the other applied techniques were essentials to locate the main lineament in the basin and therefore to specify the interest area. The realization of paleoseismological trenches based on these results, allowed validating the precision in the geophysical localization of the fault as well as the accuracy of the interpretation of the GPR profiles.
Our results allow identifying, locating with precision, and characterizing a structure hardly visible on the surface and therefore unknown. This potentially active fault could have ruptured during the Holocene by considering the active sedimentation of the basin of Llano Grande. In such a context, this study is an essential step to carry out paleoseismological studies along the faults of the Los Azufres volcanic field.
At the scale of the fault systems affecting the central TMVB, the Agua Fría graben is an excellent analog of the 10 to 20 times larger tectonic basins formed by the faults forming the MAFS. The identification of potentially active structures under the Quaternary sedimentary filling of the Llano Grande basin allows improving both the cartographic precision and the estimation of the length of faults, as well as to constrain the relation between the different faults of the same system.
This work confirms the relevance of the use of such geophysical multidisciplinary techniques for the identification and characterization of buried structures before the excavation of paleoseismic trenches. Such studies would be relevant, for example, in most of the tectonic basins bordered by the faults from the MAFS. In fact, in most of these basins, there is no information available on the presence of blind faults and their extent. These structures lack surface expression but the potential tectonic activity is important to be considered for the evaluation of the seismic hazard.
Acknowledgements
This work was supported by the SENER-CONACYT grants (P17-CeMIEGeo project) and by the Universidad Nacional Autónoma de México (PAPIIT grant IA102317 and IN108220). We are thankful to INICIT-UMSNH for the use of their infrastructure and Laboratorio de Sismología y Geofísica Aplicada; and to Instituto de Ingeniería-UABC for the Reflex software license. The authors are grateful to the CFE (Comisión Federal de Electricidad) for allowing us to carry out the studies in the Llano Grande area. Sincere appreciation is extended to Isabel Israde-Alcántara, Oscar Campos-Enríquez, Dulce Gutiérrez, Magda Velázquez, Avith Mendoza, Diana Soria, Oscar García, Abigail Córdova, Adrián Jiménez, Luis Yegres and Juan Pablo Campos for their valuable support during field acquisitions, comments and contribution to this work. Dedicated to the Memory of Víctor Hugo Garduño Monroy who was the instigator of this study. This manuscript was greatly improved by comments and suggestions from Pedro Reyes and an anonymous reviewer.
References
Annan, A., 2001, Ground Penetrating Radar Workshop Notes: Sensors and Software, Inc., Mississauga, Ontario, Canada, 192 p.
Araffa, S. A. S, El-Bohoty, M., Heleika M., A., Mekkawi, M., Ismail, E., Khalil, A., Abd El-Razek, E. M., 2017, Implementation of magnetic and gravity methods to delineate the subsurface structural features of the basement complex in central Sinai area, Egypt: NRIAG Journal of Astronomy and Geophysics, 7, 162-174. https://doi.org/10.1016/j.nrjag.2017.12.002
Araffa, S. A. S Sabet, H. S., Mahmoud, M. H., 2019, Tectonics mapping using geophysical data around Nuweiba area, Gulf of Aqaba, Sinai, Egypt: NRIAG Journal of Astronomy and Geophysics, 8(1), 73-83. https://doi.org/10.1080/20909977.2019.1615802
Arce, J.L., Macías, J.L., Rangel, E., Layer, P., Garduño-Monroy, V.H., Saucedo, R., García, F., Castro, R., Pérez-Esquivias, H., 2012, Late Pleistocene rhyolitic explosive volcanism at Los Azufres Volcanic Field, central Mexico, in Aranda-Gómez, J.J., Tolson, G., Molina-Garza, R.S., (eds.), The Southern Cordillera and Beyond: Geological Society of America Field Guide, 25, 45-82. https://doi.org/10.1130/2012.0025(04)
Arzate, J., Lacan, P., Corbo-Camargo, F., Arango-Galván, C., Félix-Maldonado, R., Pacheco, J., León-Loya, R., 2018, Crustal structure of the Eastern Acambay Graben, Central Mexico, from integrated geophysical data: Revista Mexicana de Ciencias Geológicas, 35(3), 228-239. https://doi.org/10.22201/cgeo.20072902e.2018.3.864
Astiz-Delgado, L.M., 1980, Sismicidad en Acambay, Estado de México - el temblor del 22 de febrero de 1979: México, D.F., UNAM, Facultad de Ingeniería, Tesis de maestría, 130 p.
Audemard, F. A., 2003, Estudios paleosísmicos por trincheras en Venezuela: métodos, alcances, aplicaciones, limitaciones y perspectivas: Revista Geográfica Venezolana, 44(1), 11-46.
Audemard, F. A., 2005, Paleoseismology in Venezuela: objectives, methods, applications, limitations and perspectives: Tectonophysics, 408 (1-4), 29-61. https://doi.org/10.1016/j.tecto.2005.05.034
Audemard, F. A., Singer P., A., 1996, Active fault recognition in northwestern Venezuela and its seismogenic characterization: Neotectonic and paleoseismic approach: Geofísica Internacional, 35(3), 245-255.
Audemard, F. A., González, J., Rodríguez, J. A., Schmitz, M., Singer, A., 2000, Aportes de Funvisis a la evaluación de la amenaza sísmica en Venezuela y de sus potenciales efectos sobre la infraestructura (de la vivienda modesta a la instalación estratégica). In Lafuente M., Genatios, C, Castilla, E., Garcés, F., Marinilli, A., Anteliz, E. and Maggi, G. (eds.), Desastres sísmicos: escenarios, seguridad y prevención en ciudades de países en desarrollo. Centro de Ingeniería Sísmica –CESIS-IMME-UCV-. Caracas. AS-1 a AS-24.
Audemard, F. A., Ollarves, R., Díaz, G., Bechtold, M., Cataldi, A, 2006, El geo-radar como herramienta para la definición de fallas activas: aplicación en el sector central de la falla de Boconó, estado Mérida, Venezuela: Revista de la Facultad de Ingeniería de la U.C.V., 21(4), 57–70.
Bano, M., Edel, J. B., Herquel, G., EPGS class 2001-2002, E., 2002, Geophysical investigation of a recent shallow fault: The Leading Edge, 21(7), 648-650. https://doi.org/10.1190/1.1497317
Blecha V., Fischer, T., Tábořík, P., Vilhem, J., Klanica, R., Valenta, J., Štěpančíková, P., 2018, Geophysical evidence of the Eastern Marginal Fault of the Cheb Basin (Czech Republic): Studia Geophysica et Geodaetica, 62, 660–680. https://doi.org/10.1007/s11200-017-0452-9
Brixová, B., Mosná, A., Putiska, R., 2018, Applications of shallow seismic refraction measurements in the Western Carpathians (Slovakia): case studies: Contributions to Geophysics and Geodesy, 48(1), 1–21. https://doi.org/10.2478/congeo-2018-0001
Busby, J.P., Merritt, J.W., 1999, Quaternary deformation mapping with ground penetrating radar: Journal of Applied Geophysics, 41, 75–91. https://doi.org/10.1016/S0926-9851(98)00050-0
Camacho, P., 1976, Mapa preliminary del área geotérmica de Los Azufres, Michoacán, in Cathelineau, M., Oliver, R., Nieva, D., 1987, Geochemistry of volcanic series of the Los Azufres geothermal field (Mexico): Geofísica Internacional, 26-2, 273-290.
Campos Medina, J.P., 2018, Estudio paleosismológico del segmento norte de la falla Agua Fría, Los Azufres, Michoacán: México, Juriquilla, Centro de Geociencias, UNAM, Tesis de maestría, 88 p.
Campos-Enríquez, J.O., Garduño-Monroy, V. H., 1995, Los Azufres silicic center (Mexico): inference of caldera structural elements from gravity, aeromagnetic, and geoelectric data: Journal of Volcanology and Geothermal Research, 67, 123-152. https://doi.org/10.1016/0377-0273(94)00094-W
Christie, M., Tsoflias, G.P., Stockli, D.F., Black, R., 2009, Assessing fault displacement and off-fault deformation in an extensional tectonic setting using 3-D ground penetrating radar imaging: Journal of Applied Geophysics, 68, 9–16. https://doi.org/10.1016/j.jappgeo.2008.10.013
Cinti, F. R., Pauselli, C., Livio, F. , Ercoli, M., Brunori, C.A., Ferrario, M.F., Volpe, R., Civico, R., Pantosti, D., Pinzi, S., De Martini, P.M., Ventura, G., Alfonsi, L., Gambillara, R., Michetti, A.M., 2015, Integrating multidisciplinary, multiscale geological and geophysical data to image the Castrovillari fault (Northern Calabria, Italy): Geophysical Journal International, 203(3), 1847–1863. https://doi.org/10.1093/gji/ggv404
Daniels, J. J., 2000, Ground Penetrating Radar Fundamentals: Department of Geological Sciences, The Ohio State University, Appendix to a report to the U.S.E.P.A, Region V, 21 p.
Davis, J.L., Annan, A.P., 1989, Ground penetrating radar for high resolution mapping of soil and rock stratigraphy: Geophysical Prospecting, 37, 531–555. https://doi.org/10.1111/j.1365-2478.1989.tb02221.x
De La Cruz, V., Aguilar, J., Ortega, D., Sandoval, J. M., 1983, Estudio geológico-estructural a detalle del campo geotérmico Los Azufres, Mich.: Departamento de exploraciones, CFE, informe 9-82, 62 p.
Demanet, D., Renardly, F., Vanneste, K., Jongmans, D., Camelbeek, T., Meghraoui, M., 2001, The use of geophysical prospecting for imaging active faults in the Roer Graben, Belgium: Geophysics, 66, 78-89. https://doi.org/10.1190/1.1444925
Dobson, P.F., Mahood, G.A., 1985, Volcanic stratigraphy of the Los Azufres geothermal area, Mexico: Journal of Volcanology and Geothermal Research, 25 (3-4), 273-287. https://doi.org/10.1016/0377-0273(85)90017-4
Ercoli, M., Pauselli, C., Frigeri, A., Forte, E., Federico, C., 2013, Geophysical paleoseismology” through high resolution GPR data: a case of shallow faulting imaging in Central Italy: Journal of Applied Geophysics, 90, 27-40. https://doi.org/10.1016/j.jappgeo.2012.12.001
Ferrari, L., Garduño, V. H., Pasquarè, G., Tibaldi, A., 1991, Geology of Los Azufres Caldera, Mexico, and its relationships with regional tectonics: Journal of Volcanology and Geothermal Research, 47 (1-2), 129-148. https://doi.org/10.1016/0377-0273(91)90105-9
Ferrari, L., 2000, Avances en el conocimiento de la Faja Volcánica Transmexicana durante la última década: Boletín de la Sociedad Geológica Mexicana, 53, 84-92. https://doi.org/10.18268/BSGM2000v53n1a5
Ferrari, L., Orozco-Esquivel, T., Manea, V., Manea, M., 2012, The dynamic history of the Trans-Mexican Volcanic Belt and the Mexico subduction zone: Tectonophysics, 522,122–149. https://doi.org/10.1016/j.tecto.2011.09.018
Ferreira, F.J.F., Souza, J., Bongiolo, A.B.S., De Castro, L.G., 2013, Enhancement of the total horizontal gradient of magnetic anomalies using the tilt angle: Geophysics, 78, (3), J33-J41. https://doi.org/10.1190/geo2011-0441.1
Figueroa, J., 1987, Isosistas de Grandes Temblores Ocurridos en la República Mexicana: Instituto de Ingeniería, UNAM, Informe, 59 p.
Garcia, J. G., Ness, G. E., 1994, Inversion of the power spectrum from magnetic anomalies: Geophysics, 59(3), 391-400. https://doi.org/10.1190/1.1443601
Garduño-Monroy, V.H., 1987, Resumen de las conclusiones del modelo geológico regional del campo geotérmico de Los Azufres, Mich: Departamento de exploración, CFE, Reporte GG 9/879-82, 62 p.
Garduño-Monroy, V. H., Pérez, R., Israde, I., Rodríguez, M. A., Szynkaruk, E., Hernández, V. M., García, M. L., Corona, P., Ostroumov, M., Medina, V. H., García, G.; Carranza, O., Lopez, E., Mora, J. C., 2009, Paleoseismology of the southwestern Morelia-Acambay fault system, central Mexico: Geofísica Internacional, 48(3), 319-335.https://doi.org/10.22201/igeof.00167169p.2009.48.3.29
Gianiyu, S.A., Badmus, B.S., Awoyemi, M.O., Akinyemi, O.D. and Olurin O.T., 2013, Upward continuation and reduction to pole process on aeromagnetic data of Ibadan Area, South-Western Nigeria: Earth Science Research, 2(1), 66-73. https://doi.org/10.5539/esr.v2n1p66
Glen, J. M.G., Egger, A. E., Ponce, D. A., 2008, Structures Controlling Geothermal Circulation Identified Through Gravity and Magnetic Transects, Surprise Valley, California, Northwestern Great Basin: GRC Transactions, 32, 279-283.
Gómez-Ortiz, D., Martín-Velázquez, S., Martín-Crespo, T., Márquez, A., Lillo, J., López, I. Carreño, F., Martín-González, F., Herrera, R., De Pablo, M. A., 2007, Joint application of ground penetrating radar and electrical resistivity imaging to investigate volcanic materials and structures in Tenerife (Canary Islands, Spain): Journal of Applied Geophysics, 62, 287–300. https://doi.org/10.1016/j.jappgeo.2007.01.002
Gunda, G.K.T., Balaji, S., Champati Ray, P.K., Bhat, G. R., Balakrishna, Kannaujiya, S., 2020, Geophysical characterisation of the active fault geometry and trends in tectonic deformation in the shallow stratigraphy along active faults, South Andaman, India: Journal Geological Society of India, 95, 286–292. https://doi.org/10.1007/s12594-020-1427-y
Hermana, M., Genisa, M. Lubis, L., Sum CW., 2019, Identification of Active Faults in Landslide-Prone Regions Using Ground-Penetrating Radar: A Case Study from Bandung, Indonesia: Earth Crust, 4, 1-12. https://doi.org/10.5772/intechopen.85397
Johnson, C.A., Harrison, C.G.A., 1990, Neotectonics in central Mexico: Physics of the Earth and Planetary Interiors, 64 (2-4), 187-210. https://doi.org/10.1016/0031-9201(90)90037-X
Jol, H., Bristow, C., 2003, GPR in sediments: advice on data collection, basic processing and interpretation, a good practice guide: Geological Society London Special Publications, 211(1), 9-27. https://doi.org/10.1144/GSL.SP.2001.211.01.02
Joshi, P., Mautya, D. M., Chowksey, V., Chamyal, L. S., 2012, Shallow subsurface mapping of active faults using GPR in the seismically active Kachchh palaeo-rift basin, Western India: implication for neotectonic activity, in 14th International Conference on Ground Penetrating Radar (GPR), Shanghai, China, 844-849. https://doi.org/10.1109/ICGPR.2012.6254980
Keating, P.B., Pilkington, M., 1990, An automated method for the interpretation of magnetic vertical-gradient anomalies: Geophysics, 55 (3), 336-343. https://doi.org/10.1190/1.1442841
Lacan P., Nivière B., Rousset D., Sénéchal P., 2012, Late Pleistocene folding above the Mail Arrouy Thrust, North-Western Pyrenees (France): Tectonophysics, 541-543, 57-68. https://doi.org/10.1016/j.tecto.2012.03.022
Lacan, P., Ortuño, M., Audin, L., Perea, H., Baize, S., Aguirre-Díaz, G., Zúñiga, F.R., 2018, Sedimentary evidence of historical and prehistorical earthquakes along the venta de Bravo fault system, Acambay graben (Central Mexico): Sedimentary Geology, 365, 62–77. https://doi.org/10.1016/j.sedgeo.2017.12.008
Lacan, P., Arango-Galván, C., 2021, Geophysical evidences of the 1912 earthquake rupture along the central fault system of the Acambay Graben, Central Mexico: Boletín de la Sociedad Geológica Mexicana, 73(2),A250121. http://dx.doi.org/10.18268/BSGM2021v73n2a250121
Langridge, R.M., Weldon, II, R.J., Moya, J.C., Suárez, G., 2000, Paleoseismology of the 1912 Acambay earthquake and the Acambay-Tixmadejé fault, trans-Mexican volcanic belt: Journal of Geophysical Research Atmospheres, 105(B2), 3019-3037. https://doi.org/10.1029/199JB900239
Langridge, R.M., Persaud, M., Zúñiga, F.R., Aguirre-Díaz, G.J., Villamor, P., Lacan, P., 2013, Preliminary paleoseismic results from the Pastores fault and its role in the seismic hazard of the Acambay graben, Trans-Mexican Volcanic Belt, México: Revista Mexicana de Ciencias Geológicas, 30, 463–481.
Lillie, R. J., 1999, Whole Earth Geophysics. Prentice Hall. New Jersey, 361 p.
López-Hernández, A., 1991, Análisis estructural del campo geotérmico de Los Azufres, Mich. Interpretación de datos superficiales y de subsuelo: Oficina de Geología, CFE, Infome 11(91), 137 p.
Macías, J.L., Arce, J.L., Garduño, V.H., Castro, R., García-Tenorio, F., Saucedo, R., 2008, Estudio vulcanológico y estructural de la secuencia estratigráfica Mil Cumbres y la zona geotérmica de Los Azufres, Michoacán: Comisión Federal de Electricidad, reporte interno, 73 p.
Malik, J.N., Mohanty, C., 2007, Active tectonic influence on the evolution of drainage and landscape: geomorphic signatures from frontal and hinterland areas along Northwestern Himalaya, India: Journal of Asian Earth Sciences, 29(5–6), 604–618. https://doi.org/10.1016/j.jseaes.2006.03.010
Martínez-Reyes, J., Nieto-Samaniego, A.F., 1990, Efectos geológicos de la tectónica reciente en la parte central de México: Revista del Instituto de Geología de la Universidad Nacional Autónoma de México, 9, 33–50.
Mazzoldi, A., Garduño-Monroy, V. H., Gómez-Cortes, J. J., Guevara J. A., 2020, Geophysics for geothermal exploration. Directional-derivatives-based computational filters applied to geomagnetic data at lake Cuitzeo, México: Geofísica Internacional 59-2, 105-135. https://doi.org/10.13140/RG.2.2.15903.10403
Mendoza-Ponce, A., Figueroa-Soto, A., Soria-Caballero, D., Garduño-Monroy, V. H., 2018, Active faults sources for the Pátzcuaro–Acambay fault system (Mexico): fractal analysis of slip rates and magnitudes Mw estimated from fault length: Natural Hazards and Earth System Sciences, 18, 3121-3135. https://doi.org/10.5194/nhess-18-3121-2018
Nabighian, M.N., 1972, The analytic signal of two-dimensional magnetic bodies with polygonal cross-section: Its properties and use for automated anomaly interpretation: Geophysics, 37, 507-517. https://doi.org/10.1190/1.1440276
Nabighian, M.N., 1974, Additional comments on the analytic signal of two dimensional magnetic bodies with polygonal cross-section: Geophysics, 39, 85-92. https://doi.org/10.1190/1.1440416
Neal, A., 2004, Ground penetrating radar and its use in sedimentology: principles, problems, progress: Earth-Science Reviews, 66, 261–300. https://doi.org/10.1016/j.earscirev.2004.01.004
Nguyen, F., Garambois, S., Chardon, D., Hermitte, D., Bellier, O., Jongmans, D., 2007, Subsurface electrical imaging of anisotropic formations affected by a slow active reverse fault, Provence, France: Journal of Applied Geophysics, 62(4), 338-353. https://doi.org/10.1016/j.jappgeo.2007.03.003
Oldecop, L., Perucca, L., 2012, Aplicabilidad de métodos de evaluación de la amenaza sísmica para un proyecto minero (basada en datos neotectónicos, instrumentales e históricos), Andes Centrales, San Juan, Argentina: Boletín de la Sociedad Geológica Mexicana, 64 (2), 215-228. http://dx.doi.org/10.18268/BSGM2012v64n2a7
Ortuño, M., Zúñiga, F.R., Aguirre-Díaz, G.J., Carreón-Freyre, D., Cerca, M., Roverato, M., 2015, Holocene paleo-earthquakes recorded at the transfer zone of two major faults: the Pastores and Venta de Bravo faults (Trans-Mexican Volcanic Belt): Geosphere 11, 160–184. https://doi.org/10.1130/GES01071.1
Ortuño, M., Corominas, O., Villamor, P., Zúñiga, R.F., Lacan, P., Aguirre-Díaz, G., Perea, H., Štěpančíková, P., Ramírez-Herrera, M.T., 2019, Evidence of recent ruptures in the central faults of the Acambay Graben (central Mexico): Geomorphology, 326, 17–37. https://doi.org/10.1016/j.geomorph.2018.07.010
Pasquarè, G., Garduño, V.H., Tibaldi, A., Ferrari, M., 1988, Stress pattern evolution in the Central Sector of the Mexican Volcanic Belt: Tectonophysics, 146, 352-364. https://doi.org/10.1016/0040-1951(88)90099-6
Pauselli, C., Federico, C., Frigeri, A., Orosei, R., Barchi, M. R., Basile, G., 2010, Ground penetrating radar investigations to study active faults in the Norcia Basin (central Italy): Journal of Applied Geophysics, 72, 39-45. https://doi.org/10.1016/j.jappgeo.2010.06.009
Pellerin, C.L.M., Christensen, N.I., 1998, Interpretation of crustal seismic velocities in the San Gabriel-Mojave region, southern California: Tectonophysics, 286, 253-271. https://doi.org/10.1016/S0040-1951(97)00269-2
Pérez-Esquivias, H., Macías, J.L., Garduño-Monroy, V.H., Arce, J.L., García-Tenorio, F., Castro-Govea, R., Layer, P., Saucedo, R., Martínez, C., Jiménez-Haro, A., Valdez, G., Meriggi, L., Hernández, R., 2010, Estudio vulcanológico y estructural de la secuencia estratigráfica Mil Cumbres y del campo de Los Azufres, Michoacán: Geotermia, 23, 51-63.
Pradal, E., Robin, C., 1994, Long-lived magmatic phases at Los Azufres volcanic center, Mexico: Journal of Volcanology and Geothermal Research, 63 (3-4), 201-215. https://doi.org/10.1016/0377-0273(94)90074-4
Pueyo Anchuela, Ó., Lafuente, P., Arlegui, L., Liesa, C.L., Simón J.L., 2016, Geophysical characterization of buried active faults: the Concud Fault (Iberian Chain, NE Spain): International Journal of Earth Sciences, 105, 2221–2239. https://doi.org/10.1007/s00531-015-1283-y
Rashed, M., Kawamura, M.G., Hiroo, N., Miyata, T., Nakagawa, K., 2003. Ground penetrating radar investigation across Uemachi fault, Osaka, Japan: Journal of Applied Geophysics, 53, 63–75. https://doi.org/10.1016/S0926-9851(03)00028-4
Robinson, M., Bristow, C., McKinley, J, Ruffell, A., 2013, Ground Penetrating Radar: Geomorphological Techniques, British Society for Geomorphology, Part 1, sec 5.5, 1-26.
Rodríguez-Pérez, Q., Zúñiga, F.R., 2017, Seismicity characterization of the maravatío-Acambay and Actopan regions, Central Mexico: Journal of South American Earth Sciences, 76, 264–275. https://doi.org/10.1016/j.jsames.2017.03.013.
Sandmeier, K. J., 2016, Reflexw – GPR and seismic processing software. Sandmeier geophysical research 2020 [cit. 2020-09-05]. Available on: http://www.sandmeier-geo.de/reflexw.html
Shah, M., Sircar, A., Vaidya, D., Sahajpal, S., Chaudhary, A., Dhale, S., 2015, Overview of geotermal surface exploration methods: International Journal of Advance Research and Innovative Ideas in Education (IJARIIE), 1 (4), 55-64.
Skrame, K., Di Filippo, M., Di Nezza, M., 2016, Contribution of the Magnetic Horizontal Gradient Operator (MHGO) for the Interpretation of the Magnetic Anomalies, in Conference Proceedings, Near Surface Geoscience 2016 - 22nd European Meeting of Environmental and Engineering Geophysics, cp-495-00113. https://doi.org/10.3997/2214-4609.201602014
Soria-Caballero, D. C., Garduño-Monroy, V. H., Alcalá, M., Velázquez-Bucio, M. M., Grassi, L., 2019, Evidence for quaternary seismic activity of the La Alberca-Teremendo fault, Morelia region, Trans-Mexican Volcanic Belt: Revista Mexicana de Ciencias Geológicas, 36(2), 242-258. https://doi.org/10.22201/cgeo.20072902e.2019.2.1092
Suárez, G., 1992, El sismo de Jalapa del 3 de Enero de 1920: Revista de Ingeniería Sísmica, 42, 3–15. https://doi.org/10.18867/ris.42.290
Suárez, G., Novelo-Casanova, D.A., 2018, A pioneering Aftershock study of the destructive 4 January 1920 Jalapa, México, earthquake: Seismological Research Letters, 89 (5), 1894–1899. https://doi.org/10.1785/0220180150
Suárez, G., Caballero‐Jiménez, G.V., Novelo‐Casanova, D.A., 2019, Active crustal deformation in the Trans‐Mexican Volcanic Belt as evidenced by historical earthquakes during the last 450 years: Tectonics, 38, 1–19. https://doi.org/10.1029/2019TC005601
Suárez, G., Ruiz‐Barón, D., Chico‐Hernández, C., Zúñiga, F. R., 2020, Catalog of preinstrumental earthquakes in central Mexico: epicentral and magnitude estimations based on macroseismic data: Bulletin of the Seismological Society of America, 110(6), 3021-3036. https://doi.org/10.1785/0120200127
Sunyé-Puchol, I., Lacan, P., Ortuño, M., Villamor, P., Audin, L., Zúñiga, F.R., Langridge, R.M., Lawton, T.F., 2015, La Falla San Mateo: nuevas evidencias paleosismológicas de fallamiento activo en el Graben de Acambay, México: Revista Mexicana de Ciencias Geológicas, 32, 361–376.
Suter, M., 2016, Structure and Holocene rupture of the Morelia fault, trans‐Mexican volcanic belt, and their significance for seismic‐hazard assessment: Bulletin of the Seismological Society of America, 106, 2376–2388. https://doi.org/10.1785/0120160092
Suter, M., 2019, Macroseismic study of the devastating 22– 23 October 1749 earthquake doublet in the Northern Colima Graben (Trans-Mexican Volcanic Belt, Western Mexico): Seismological Research Letters, 90(6), 2304-2317. https://doi.org/10.1785/0220190162
Suter, M., Quintero, O., Johnson, C. A., 1992, Active faults and state of stress in the central part of the Trans-Mexican Volcanic Belt, Mexico 1. The Venta de Bravo fault: Journal of Geophysical Research, 97, 11983–11993. https://doi.org/10.1029/91JB00428
Suter, M., Quintero-Legorreta, O., López-Martínez, M., Aguirre-Díaz, G.J., Farrar, E., 1995, The Acambay graben: active intra arc extension in the trans-Mexican volcanic belt, Mexico: Tectonics, 14, 1245–1262. https://doi.org/10.1029/95TC01930
Suter, M., Carrillo-Martínez, M., Quintero-Legorreta, O., 1996, Macroseismic study of shallow earthquakes in the central and eastern parts of the trans-Mexican volcanic belt, Mexico: Bulletin of the Seismological Society of America, 86 (6), 1952-1963.
Suter, M., López-Martínez, M., Quintero-Legorreta, O., Carrillo-Martínez, M., 2001, Quaternary intra-arc extension in the central Trans-Mexican volcanic belt: Geological Society of America Bulletin, 113 (6), 693–703. https://doi.org/10.1130/0016-7606(2001)113<0693:QIAEIT>2.0.CO;2
Tatiana, F.Q., Angelo, S., 1998, Exploration of a lignite bearing in Northern Ireland, using Maurizio ground magnetic: Geophysics, 62 (4), 1143-1150. https://doi.org/10.1190/1.1443777
Terzic R. Z., Quigley C. M., Lopez F., 2017, Detailed Seismic Hazard assessment of Mt Bold area: comprehensive site-specific investigations on Willunga Fault: ANCOLD 2017 Conference Proceedings, The Australian National Committee.
Terzic, Z., Ermakov, O., Urosevic, M., 2019, Geophysical Survey as a part of a Multi-tiered Investigation in Fault Characterization and Dam Seismic Hazard Assessment – a case study from South Australia (online). Available in:http://rayfract.com/pub/TERZIC_ERMAKOV_UROSEVIC_AGS_Paper.pdf. Accessed on 23rd November 2020.
Urbina, F., Camacho, H., 1913, La zona megaseísmica Acambay-Tixmadejé, Estado de México, conmovida el 19 noviembre 1912: Boletín del Instituto Geológico de México, 32, 125.
Wallace, S.C., Nobes, D.C., Davis, K.J., Burbank, D.W., White, A., 2010, Three-dimensional GPR imaging of the Benmore anticline and stepover of the Ostler Fault, South Island, New Zealand: Geophysical Journal International, 180, 465-474. https://doi.org/10.1111/j.1365-246X.2009.04400.x
Xavier, P. M., Gibson, P., 2011, Electrical resistivity and Ground Penetrating Radar for the characterization of the internal architecture of Quaternary sediments in the Midlands of Ireland: Journal of Applied Geophysics, 75 (4), 638-647. https://doi.org/10.1016/j.jappgeo.2011.09.019
Yan Z., Clayton R.W., Saleeby J., 2005, Seismic refraction evidence for steep fault cutting highly attenuated continental basement in the central Transverse ranges, California: Geophysical Journal International, 160, 651–666. https://doi.org/10.1111/j.1365-246X.2005.02506.x
Zelt, C. A., Smith, R. B., 1992, Seismic traveltime inversion for 2-D crustal velocity structure: Geophysical Journal International, 108, 16–34. https://doi.org/10.1111/j.1365-246X.1992.tb00836.x
Zúñiga, F. R., Lacan, P., Rodríguez-Pérez, Q., Márquez-Ramírez, V. H., 2020, Temporal and spatial evolution of instrumented seismicity in the Trans-Mexican Volcanic Belt: Journal of South American Earth Sciences, 98, 1-10. https://doi.org/10.1016/j.jsames.2019.102390
Manuscript received: September 15, 2020
Corrected manuscript received: December 20, 2020
Manuscript accepted: January 2, 2021