
|
Boletín de la Sociedad Geológica Mexicana Volumen 71, núm. 1, 2019, p. 11- 20 http://dx.doi.org/10.18268/BSGM2019v71n1a2
|
 |
A micromorphological analysis for quantifying structure descriptors in a young constructed Technosol
Françoise Watteau1, Nouhou Salifou Jangorzo1,2, Christophe Schwartz1
1 Laboratoire Sols et Environnement, UL-INRA UMR 1120, Vandœuvre-lès-Nancy, 54518, France.
2 Université Dan Dicko Dankoulodo de Maradi, Maradi, BP 465 ADS, Niger.
This email address is being protected from spambots. You need JavaScript enabled to view it.
Abstract
Evaluating soil structure dynamics is a major challenge when analysing or modelling pedogenesis. Constructed Technosols are considered, by definition, to be good candidates for pedogenetic studies, insofar as their initial characteristics and implementation conditions are controlled. Thus, we developed an approach based on image analysis of soil microstructures in order to specify the structure dynamics of a constructed Technosol. We described and quantified porosity and aggregation descriptors on a microscale (1) from pictures of mesocosms performed during 14 months, using an innovative automatic high-resolution image-acquisition device (Soilinsight®), and (2) from thin sections sampled in situ in a 1 ha field experiment at t0 and t2 (17 months). Plant root system architecture of Lupinus albus and the behavior of introduced earthworms (Lumbricus castaneus) were described using the Soilinsight® device. After 14 months, the pore surface was 10 times greater in the presence of plants and macrofauna than in the control samples. Although the biological activity promoted the genesis of aggregates, their dynamics were irregular. In fact, the proportion of aggregates varied depending on both root age and worm action. In situ, the soil was progressively compacted due to a significant decrease in the number of >2000 µm pores. In the same way, three aggregate descriptors—number, area and shape—were selected as the most significant indicators of soil aggregation evolution during the early stages of pedogenesis. In conclusion, this approach, based on the quantification of microstructure parameters, did indeed allow the description and monitoring of 2D soil structure dynamics in both field and mesocosms conditions. Completed with 3D soil structure data, this micromorphological analysis could advantageously contribute to the impact of climatic and biological agents modelling on a structural evolution of Technosols during initial pedogenesis.
Key words: micropedology, biological activity, structure dynamics, image analysis, Soilinsight®
Resumen
La evaluación de la dinámica estructural del suelo es una de las principales dificultades para analizar o modelar edafogénesis. Los Tecnosuelos construidos son considerados, por definición, como buenos candidatos para el estudio de la edafogénesis, ya que tanto sus características iniciales como las condiciones de implementación están controladas. Así, desarrollamos un enfoque basado en el análisis de imagen de las microestructuras del suelo para especificar la dinámica estructural de un Tecnosuelo construido. Describimos y cuantificamos los descriptores de porosidad y agregación a microescala en (1) imágenes captadas de un experimento en mesocosmos desarrollado durante 14 meses, mediante la utilización de un sistema innovador para la adquisición automática de imágenes de alta resolución (Soilinsight®) y en (2) láminas delgadas muestreadas in situ en una parcela experimental de 1 ha a t0 y t2 (17 meses). La arquitectura del sistema radical de Lupinus albus y el comportamiento de las lombrices (Lumbricus castaneus) introducidas en los mesocosmos fueron descritos gracias al sistema Soilinsight®. Después de 14 meses, la superficie de los poros es 10 veces mayor en presencia de plantas y macrofauna que en los controles. Si bien la actividad biológica promovió la formación de los agregados, su dinámica fue irregular. De hecho, la proporción de agregados varió en función de la edad de las raíces y de la acción de las lombrices. In situ, el suelo ha sufrido una compactación progresiva debido a una disminución significativa del número de poros > 2000 µm. De la misma forma, tres descriptores de los agregados -número, área y forma- han sido seleccionados como los indicadores más significativos de la evolución de la agregación del suelo durante las fases tempranas de la edafogénesis. En conclusión, el enfoque basado en la cuantificación de parámetros microestructurales ha permitido la descripción y monitoreo en 2D de la dinámica estructural del suelo en condiciones de campo y de mesocosmos. Este análisis micromorfológico, combinado con datos de la estructura del suelo en 3D, puede contribuir a la modelación del impacto de agentes climáticos y biológicos sobre la evolución estructural de Tecnosuelos durante las primeras fases de la edafogénesis.
Palabras clave: microedafología, actividad biológica, dinámica estructural, análisis de imagen, Soilinsight®
1. Introduction
Soil measurements have traditionally been used to demonstrate that soil architecture is one of the key drivers of soil processes (Otten et al., 2012). Micromorphology is helpful in soil studies, as it consists of the integrated use of various microscopic techniques for studying the arrangement and the nature of components in soils and sediments (Courty, 1991). Many works have attested to soil feature characterization on thin sections as a significantly contributing tool for the understanding of pedogenetic processes, such as mineral weathering, organic matter degradation, soil structure dynamics, or particle-leaching (Stoops et al., 2010). As non-destructive methods are required, advances in image analysis procedures or the use of other techniques such as X-ray Computed Tomography (CT) have appeared over recent decades, becoming powerful ways of visualizing and quantifying soil structure (Taina et al., 2008; Sauzet et al., 2017).
The use of the CT imaging method has already led to advances in our understanding of the representation and evolution of the soil structure itself, in the knowledge of structure-related pedological processes, as well as in the modelling of structural evolution (Vogel et al., 2010; Sammartino et al., 2012). X-ray CT is increasingly used to evaluate soil structure parameters, or even to quantify soil pore space characteristics on images with a voxel size of <50 µm (Taina et al., 2008; Munkholm et al., 2012). Many works have also explored root systems and earthworm activity using CT (e.g., Capowiez et al., 2015; Paya et al., 2015). In addition, micro X-ray CT can be combined with 3D printing to reproduce replicated static model microcosms that exhibit the soil physical heterogeneity and that are suitable for soil biological studies (Otten et al., 2012). Nevertheless, following over time a multi-scale approach, from field to microaggregate scale, for soil processes quantification, is as yet, a major challenge in pedogenetic studies.
In this way, constructed Technosols can be considered good candidates for such micropedological studies. Firstly, among those Technosols that are characterized by a significant presence of mineral and organic materials of technogenic origin (IUSS Working Group WRB, 2006), the initial characteristics and implementation conditions of constructed Technosols are controlled (Séré et al., 2008). In addition, the constructed soil profiles show clear evidence of a rapid development of new horizons that can be visually distinguished according to their color and root density (Séré et al., 2010). Secondly, taking into account the current anthropization context, where constructed Technosols appear to be a relevant alternative when restoring derelict lands, micromorphology might improve knowledge concerning the evolution and future management of such soils (Adderley et al., 2010). Thus, we set out to develop an approach based on soil micromorphology analysis to specify constructed Technosol structure dynamics.
The aim of this paper is to present the micromorphological approach used in the quantification of the pedogenetic processes of a young constructed Technosol. The current study presents some of the data obtained (i) in a mesocosm experiment where the impact of biological activity on structural dynamics was monitored for 14 months (Jangorzo et al., 2015), and (ii) on pore system architecture evolution and aggregation properties studied at t0 and t2 (17 months) in a 1 ha field experiment (Jangorzo et al., 2013, 2014). The novelty of this approach was (i) the use of an original device allowing the automatic acquisition of high-resolution images of soil structure, called Soilinsight®, and (ii) the development of specific image analysis procedures to quantify porosity and aggregation descriptors using both Soilinsight® images and thin sections.
These combined tools, describing and quantifying porosity and aggregation on a microscale, allowed us to assess the impact of pedogenetic factors on constructed Technosol structure dynamics, from field to micro-aggregate scale (Jangorzo et al., 2013, 2014, 2015). Recalling some of the results already published, this work deals with the presentation of a complete approach as a novel method in micromorphological research for studying the evolution and functioning of anthropized soils.
2. Materials and methods
2.1. Mesocosm experimentation: Soilinsight®
Soilinsight® is an original device, which performs both the acquisition and storage of high-resolution images. It was built to automatically generate images of soil contained in mesocosms, over a middle-term period of 14 months. The mesocosms were 35 cm long, 21 cm wide, and 5 cm deep boxes made of opaque polymethyl methacrylate (Jangorzo et al., 2015). One side of the mesocosm consisted of an non-reflective glass allowing us to observe the soil surface and acquire images. The system was programmed to capture one image (A4 format) per 2 h in TIFF format at a resolution of 1,200 dpi (the minimum size of a pixel is 21.67 µm).
The mesocosms were filled with the same three parent materials used in the in situ experimentation (Séré et al., 2010), after elimination of the meso- and macro-fauna (Jangorzo et al., 2015). From the bottom to the top, three horizons of distinct materials were deposited in the mesocosms in order to reproduce a constructed Technosol: (1) a 3.1 cm deep, 500 g layer of gravel (retained by a fine mesh, to ensure good drainage; (2) a 20.4 cm deep, 2 kg mixture of thermally Treated Industrial Soil (TIS) and Paper-mill Sludge (PS) (1:1 volumetric ratio) sieved at 500 µm (1.17 g cm−3 bulk density); and (3) a 3.7 cm deep, 100 g layer of green waste compost (GWC), also sieved at 500 µm. At the bottom of the mesocosm, a hole was dug and connected to a tube to collect drainage water. During the experiment, the system was irrigated to maintain a moisture level between 63 and 79% of the field capacity.
In this experiment, six mesocosms were used, corresponding to two treatments: (1) plant plus fauna, and (2) control without any plant nor fauna, each replicated three times. On the first day of the experiment (t0), 4 day-old lupin seedlings (Lupinus albus) were planted in each mesocosm. The epianecic earthworm Lumbricus castaneus was chosen as the macro-fauna factor. Six earthworms were introduced 70 days after the beginning of the experiment (Jangorzo et al., 2015). All the experiment was carried out in a controlled environment (16 m3 growth chamber).
2. 2. In situ experimentation
Soil samples were collected from the experimental station belonging to the French Scientific Interest Group—Industrial Wasteland (Homécourt, northeast France, http://gisfi.univ-lorraine.fr), where a process of soil construction has been performed on a 1 ha plot. The climate is continental with a mean rainfall of 760 mm y−1 and a mean temperature of 10 °C. The pedological engineering process used for soil construction has been described by Séré et al. (2008). The constructed soil was a Spolic Garbic Hydric Technosol (Calcaric) (IUSS Working Group WRB, 2006; Séré et al., 2010). It was made of three technogenic parent materials: Green-Waste Compost (GWC), Paper-mill Sludge (PS), and thermally Treated Industrial Soil (TIS), which were stacked into layers forming three initially distinct horizons. The main characteristics of the parent materials are presented in Table 1. From bottom to top there were: 45 cm of PS, 125 cm of TIS plus PS mixture (1:1 volumetric ratio), and 15 cm of GWC.
Two different treatments, focusing on water management, were applied to the bottom of the profile: (Treatment 1) - “water buffer” (Wb) with a layer of pure PS, and (Treatment 2) -“containment” (Co) with a layer of limed and compacted pure PS. The experimental plot was divided into 24 mini-plots of 20 x 20 m, of which there were 13 Wb-modality and 11 Co-modality mini-plots (Jangorzo et al., 2013). Soil sampling was done on 04/11/2008 (t0) and 04/04/2010 (t2).
Table 1. Main parameters of the parent materials. GWC: green waste compost; PS: paper sludge; TIS: treated industrial soil.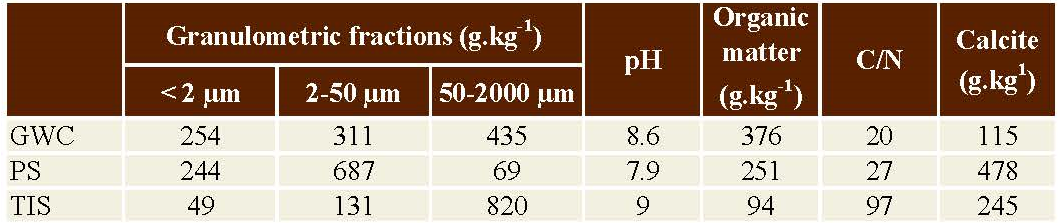
2.3. Preparation of Technosol thin sections
Twenty-three undisturbed soil cores from the in situ experimentation were sampled in Kubiena boxes (9 x 6 cm) at the interface of TIS and GWC after removing the GWC layer. One thin soil section was prepared from each sample, according to the protocol developed by Guilloré (1980) and Murphy (1986). For this purpose, the soil samples were dried by replacing water with acetone and then impregnated under vacuum with polyester resin. The consolidated block was cut into two equivalent parts. One part was fixed on a thin 9 x 6 cm glass and sliced to obtain a 20 µm soil section.
2.4. Image acquisition and analysis
All thin sections were scanned using a flatbed scanner (EPSON V750 Perfection Pro) at 1200 dpi (the minimum size of a pixel was 21.67 µm) and saved in TIFF format. Image analysis procedures are described in Jangorzo et al. (2013, 2014, 2015). These procedures were applied to both Soilinsight® images and thin section images. This permitted a comparison of all images generated by the scanner and an automatic quantification of the porosity and aggregation of a constructed Technosol, using existing algorithms. In order to avoid single-pixel pores, the macroporosity, defined as the total volume of pores with a diameter greater than 50 µm, was quantified with these scanned images. To quantify microporosity (0.5–50 µm), magnified images were generated from Soilinsight® images or from the thin sections. For the latter, we used a photonic Leica DM2500 microscope equipped with a Leica EC3 camera. The <50 µm pores were derived from magnified images and the limit of micropores quantified was set at > 0.5 µm to avoid single-pixel pores. Nine porosity parameters indicative of pore function were quantified: number of pores, surface area, perimeter, distance, volume, eccentricity, shape factor, equivalent diameter, and index of connectivity.
Statistical analyses were done on data according to time (2008–2010) or treatment (co or wb soil construction modalities). Mean comparison tests (Mann–Whitney test) and Principal Component Analysis (PCA) were performed to determine those parameters which best describe porosity. The same approach was used for the quantification of > 50 µm aggregates (Jangorzo et al., 2014). The following aggregate properties were calculated: number, area, Crofton perimeter, equivalent diameter, eccentricity and shape factor.
3. Results and discussion
3.1. Description of the constructed Technosol structural evolution
As one high-resolution photo of the glazed surface of each mesocosm was taken every 2 hours for 14 months, it was possible to create videos of the structural dynamics of the discernible soil (https://vimeo.com/131855415). Videos concerning the mesocosms with plant and macrofauna clearly highlight the role of the root system and the behaviour of earthworms in the dynamics of the constructed Technosol structure (Jangorzo et al., 2015).
After 5 months, plants ceased producing new roots and all the soil observed on the glazed face could be considered to be rhizospheric soil (Figure 1.1). From that point onwards, senescence of the roots was emphasized by the modification to their tint and nodes, which having appeared after 2 months, progressively disappeared. Roots created porosity during their growth in the soil or moved into the existing crack-like macroporosity due to the wetting–drying process. When water repeatedly flowed along roots, it transported soil particles and contributed to the formation of voids. This phenomenon became more prevalent as roots aged, due to their volume decreasing during senescence (Figure 1.2).
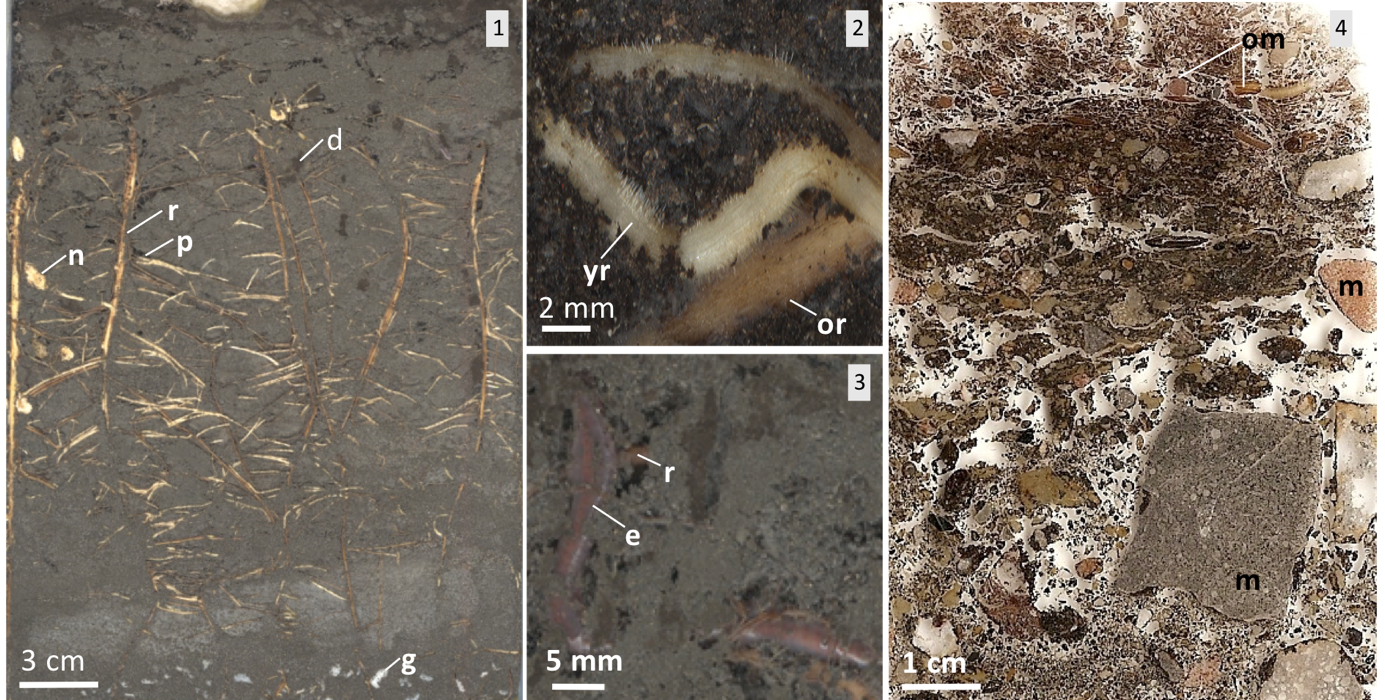
Figure 1. Views of the constructed Technosol. 1: Soilinsight® image of the glazed face at 5 months; 2 and 3: magnified Soilinsight®- images showing roots at different growth stages and earthworms, respectively; 4: thin section of constructed Technosol. e: earthworm; d: earthworm dejection; g: gravel; m: mineral; n: node; om: organic matter; or: older root; p: pore; r: root; yr: young root.
When earthworms were introduced, they moved randomly in the soil. During the first 25 days, they prospected in the first 10 cm (in the compost horizon), later they explored the deeper horizons (mixture PS/TIS), and then they came back to the compost. Their burrowing was mainly random, but preferentially occurred along roots in deeper layers. As they burrowed, earthworms could translocate compost to the PS/TIS layer or deposit faeces (Figure 1.3). The emergence of casts at the surface, or the advent of juveniles happening 5 months after the beginning of the experimentation, were also visualized.
Such information was more difficult to obtain in situ as the structural dynamics were only evaluated on two dates. Nevertheless, the soil structure observed on thin sections from field sampling resulted from the impact of all pedogenetic agents over the same time period. Both approaches were complementary as they were based on similar image analysis procedures.
Contrary to the mesocosm experiment, the field setup could not ensure the total homogeneity of the initial arrangement of parent materials (i.e., deposition mode and range of particle size). Even if the t0 sampling was performed at the same depth, observation of the 23 thin sections highlighted physical heterogeneity. This concerned the proportion of the 3 parent materials, the amount of coarse mineral components, the tint (related to the varying abundancy of the white PS and the dark TIS), or the bulk density (i.e., Figure 1.4).
At t0, porosity was mostly represented by interconnected large pores and most of the matrix consisted of non-aggregated material. At t0, aggregates of the constructed Technosol were mainly due to the soil construction process. After more than one year, the soil structure changed in both experimentations. Thus, quantification of porosity and aggregation descriptors was investigated in order to evaluate the soil evolution.
3.2. Quantification of constructed Technosol porosity
As shown by the results obtained using the image analysis procedure detailed in Jangorzo et al. (2015), the porosity in the mesocosms increased during the first days, when the soil started drying. At the end of the experiment, porosity was ten times greater than in the control (p < 0.0001). In contrast, porosity continuously decreased with time in the control treatment. The proportion of pores varied depending on the root age (young or decaying) and the burrowing of worms (Jangorzo et al., 2015). Hence, the quantification of porosity descriptors confirmed and evaluated the observed effect of roots and earthworms on the constructed Technosol porosity dynamics.
Concerning the in situ experiment, initial soil heterogeneity was evaluated by image analysis protocol and taken into account in the comparative statistical analysis of the results. Detailed information concerning the evolution of porosity parameters with time, such as the difference between the two soil construction treatments, has been validated and previously presented (Jangorzo et al., 2013, 2014).
Figure 2 summarizes the main modifications to the porosity parameters during the two years of the experiment. Between t0 and t2, the soil was progressively compacted. Mean pore surface significantly decreased (from 0.16 ± 0.06 to 0.08 ± 0.04 mm2; N = 23, p < 0.0001) while the number of pores significantly increased (from 3045 ± 729 to 4631 ± 918; N = 23, p < 0.0001).
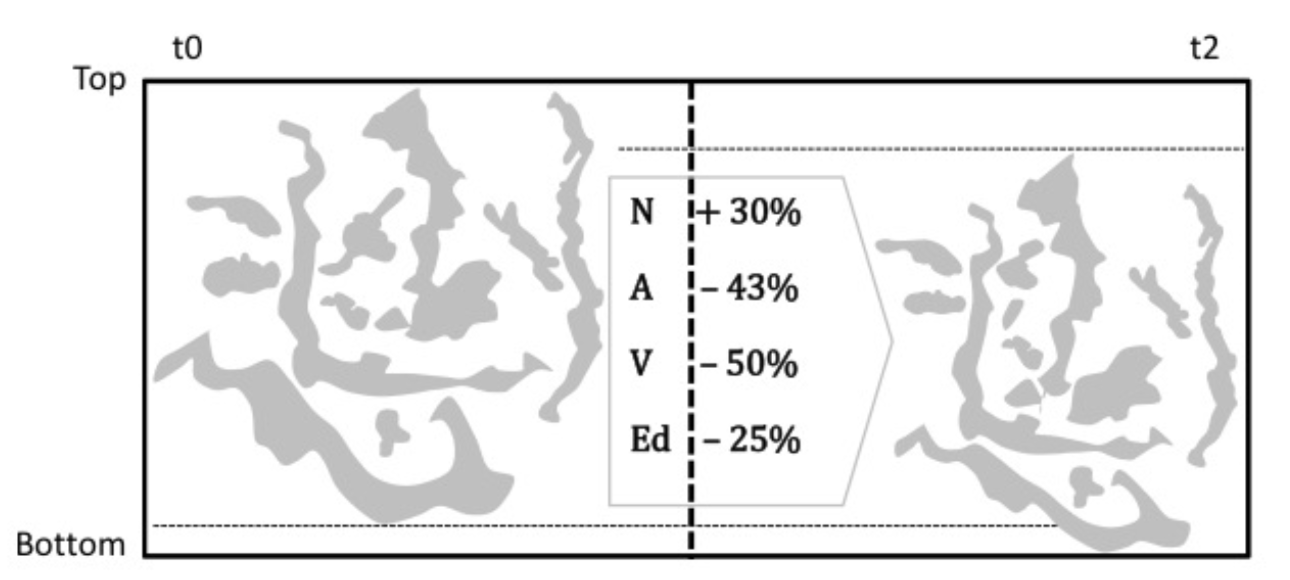
Figure 2. Porosity evolution of the superficial layer (0-9 cm under the compost layer) of the constructed Technosol between t0 and t2. N: number of pores; A: surface of pores; V: volume of pores; Ed: equivalent diameter of pores.
In the same way, the architecture of the pores also changed. For example, the number and surface of large pores (packing pores) with equivalent diameters exceeding 2000 µm decreased (respectively from 14 ± 4.35 to 11 ± 4.79, not significantly and from 27.71 ± 14.15 to 14.65 ± 10.46, significantly). After statistical analysis, the number of pores, surface area, index of connectivity and shape factor were proposed as indicators to be monitored in the study of constructed Technosol porosity evolution (PCA, 42% for factor 1).
Thereby, similar soil compaction was described both in situ and in the control mesocosm. For both, biological activity was not as developed as in the mesocosm with plant and fauna. Consequently, the Soilinsight® device indeed offered a relevant way to differentiate the impact of diverse pedogenic agents on soil porosity dynamics, in terms of process intensity. These impacts could be confirmed in field experiments to manage such soils, with particular reference to their water retention capacity.
3.3. Quantification of constructed Technosol aggregation
Analysis of images obtained using Soilinsight® showed that aggregation evolution is root-system dependent (Jangorzo et al., 2015). Aggregation was low and constant in the control mesocosm, as the percentage of aggregates did not vary throughout the experiment. However, it significantly increased in the plant–fauna treatment and, at the end of the experiment, became about 10 times greater than the control. Biological activity clearly induced the formation of 0.5–5 mm aggregates. The proportion of aggregates varied depending on the root growth and the action of worms (e.g., burrowing and cast deposits).
Over the two years in the field experiment, the number of soil aggregates increased, particularly those >50 µm (from 834 ± 379 to 1261 ± 601; Jangorzo et al., 2014). The shape of aggregates ranging between 200 and 2000 µm significantly changed (from 2.28 ± 0.21 to 2.45 ± 0.22), thus suggesting an impact of water and biological activity on these coarse aggregates. The number, shape and surface percentage of coarse aggregates (between 200 and 2000 µm) appeared, after statistical analysis, to be major indicators of aggregation dynamics over time (PCA, 61.65% for factor 1).
A relationship presenting a valid linear correlation coefficient (Pearson) between the percentages of pores and aggregates was highlighted (Jangorzo et al., 2014). This was weak at t0 (r = 0.31) and improved at t2 (r = 0.49). This confirmed that at initial time, aggregation was only due to the soil construction process. Secondly, this underlined that the constructed Technosol was structured over a period of time comparable to that of natural soils, for which a similar relationship was also found (Nandi and Luffman, 2012).
3.4. Relevance of monitoring Technosol structure on a microscale to assessing the pedogenetic processes
Morphological analysis of images from Soilinsight® and from thin sections resulted in qualitative microstructural data. Higher magnification views and SEM-EDS micro-analyses have also been used in such soils, to complete knowledge of the parent materials composition, their biodegradation or weathering, as well as their mode of association (Watteau et al., 2017). Moreover, observation of roots and biofeatures (faecal pellets, casts) on thin constructed Technosol sections has revealed biological activity. Further, micromapping of thin sections as proposed by Gutiérrez-Castorena et al. (2016) should advantageously complete these data by determining microbial activity.
In the approach presented here, soil structure dynamics could have been investigated through a high-frequency image acquisition or sampling replicates. In this way, Soilinsight® video appeared to be a relevant tool for observing soil structure dynamics at microscale. The micromorphological study of soil thin sections sampled in situ reflected how soil structure evolved in real brownfield restoration. However, this methodology involved destructive sampling, thus precluding any further sampling at the same location. By using the Soilinsight® device, numerous qualitative and quantitative data improving the knowledge of the dynamics of Technosol structure were available and monitoring was possible without destructive sampling.
On the other hand, mesocosms are used to investigate pedogenetic processes mainly in the superficial layers, whereas in situ thin sections could be sampled throughout the soil profile. Thus, even if the controlled conditions were different from field conditions, the Soilinsight® device and the in situ experiment appear to be complementary tools for specifying pedogenetic processes during the initial evolution stages of a constructed Technosol.
The challenge was then to extrapolate these in vitro and in situ data to the entire soil volume and finally to link all these data together. One way could be to use some 2D soil structure models (e.g., Schlüter et al., 2012). Another way could be to investigate the 2D data obtained in 3D.
A combination of CT analysis of mesocosms and field samplings with 2D analysis of soil structure, as presented here, would be relevant from several points of view. On the one hand, a mathematical construction of 3D soil structure from 2D data (e.g., Wu et al., 2006) could be checked by comparison with CT data. This would also help to fix the suitable number of thin sections required in order to be representative of the volumetric heterogeneity (Vogel, 2008). On the other hand, 2D analysis would improve CT data thanks (i) to the easier differentiation of organic matter versus pore and minerals, and (ii) to the continuous monitoring of biological activity over time, whereas the X Ray would be deleterious. As shown in Jangorzo et al. (2013, 2015), statistical analyses enhance some pore and aggregate descriptors as monitoring indicators of soil structure evolution in the first stages of pedogenesis. Further, studies combining 2D and 3D techniques of soil structure visualization would confirm the integration of such descriptors as variables in soil structure or soil process models (Marilleau et al., 2008; Leguédois et al., 2016).
Micromorphological analysis of the constructed Technosol allowed us to study the impact on the structure evolution of climatic, biologic and also anthropic agents (e.g., different modes of soil formulation or construction). As such information is combined with hydrodynamic data (Tifafi et al., 2017), it will enhance our understanding of the pedogenesis of constructed Technosols. Such knowledge will be very helpful, for instance in predicting the water-holding capacity of such soils, and consequently their ability to support vegetation.
4. Conclusion
Soil structure evolution can be qualitatively and quantitatively monitored on a microscale, from mesocosm to field, thanks to the approach developed here. Thus, in the current anthropization context of restoring derelict lands, such micromorphological analysis can be considered as a promising and innovative way to study constructed Technosol pedogenesis. In fact, anthropic pedogenetic processes can be differentiated from natural ones and interactions between them can be monitored over time. The data obtained in this manner could improve our knowledge of 3D soil structure dynamics, in such a way that they can be combined with other visualization techniques and integrated into soil process models.
In addition, the micromorphological analysis underlined that constructed Technosol pedogenesis is similar to that of natural soils when faced to biological factors, despite the likelihood that its composition differs from that of natural soils. Understanding the functioning and evolution of constructed Technosols is a necessity for their management. In this manner, Technosol micromorphology could provide relevant information on the relationship between soil structure and soil functions.
References
Adderley, W.P., Wilson, C.A., Simpson, I.A., Davidson, D.A., 2010, Anthropogenic features, in Stoops, G., Marcelino, V., Mees, F. (eds.), Interpretation of Micromorphological Features of Soils and Regoliths: Amsterdam, The Netherlands, Elsevier, 569‒588.
Capowiez, Y., Bottinelli N., Sammartino S., Michel E., Jouquet P., 2015, Morphological and functional characterisation of the burrow systems of six earthworm species (Lumbricidae): Biology and Fertility of Soils, 51(7), 869‒877.
Courty, M.-A., 1991, Soil micromorphology in Archaeology: Proceedings of the British Academy, 77, 39‒59.
Guilloré, P., 1980, Méthode de fabrication mécanique et en série des lames minces: Thiverval-Grignon, France, Institut National Agronomique Paris Grignon, Département des sols, 22 p.
Gutiérrez-Castorena, E.V., Gutiérrez-Castorena, M.C., González-Vargas, T., Cajuste- Bontemps, L., Delgadillo, J., Suástegui, E., Ortiz, C.A., 2016, Micromapping of microbial hotspots and biofilms from different crops using digital image mosaics of soil thin sections: Geoderma, 279, 11‒21.
IUSS Working Group WRB, 2006, World Reference Base for soil Resources 2006, A framework for international classification, correlation and communication: Rome, Italy, Food and Agriculture Organization of the United Nations, World Soil Resources Reports, 103, 128 p.
Jangorzo, N.S., Watteau, F., Schwartz, C., 2013, Evolution of the pore structure of constructed Technosol during early pedogenesis quantified by image analysis: Geoderma, 207‒208, 180‒192.
Jangorzo, N.S., Schwartz, C., Watteau, F., 2014. Image analysis of soil thin sections for a non-destructive quantification of aggregation in the early stages of pedogenesis: European Journal of Soil Science, 65(4), 485‒498.
Jangorzo, N.S., Watteau, F., Hajos, D., Schwartz, C., 2015, Nondestructive monitoring of the effect of biological activity on the pedogenesis of a Technosol: Journal of Soils and Sediments, 15(8), 1705‒1715.
Leguédois, S., Séré, G., Auclerc, A., Cortet, J., Huot, H., Ouvrard, S., Watteau, F., Schwartz, C., Morel, J.L., 2016, Modelling pedogenesis of technosols: Geoderma, 262, 199‒212.
Marilleau, N., Cambier, C., Drogoul, A., Chotte, J.L., Perrier, E., Blanchart, E., 2008, Multiscale MAS modelling to simulate the soil environment: Application to soil ecology: Simulation Modelling Practice and Theory, 16(7), 736–745.
Munkholm, L.J., Heck, R.J., Deen, B., 2012, Soil pore characteristics assessed from X-ray micro-CT derived images and correlations to soil friability: Geoderma, 181‒182, 22‒29.
Murphy, C.P., 1986, Thin Section Preparation in Soils and Sediments, Volume 1: Berkhamsted, England, AB Academic Publishers, 149 p.
Nandi, A., Luffman, I., 2012, Erosion related changes to physicochemical properties of ultisols distributed on calcareous sedimentary rocks: Journal of Sustainable Development, 5(8), 52‒68.
Otten, W., Pajor, R., Schmidt, S., Baveye, P.C., Hague, R., Falconer, R.E., 2012, Combining X-ray CT and 3D printing technology to produce microcosms with replicable, complex pore geometries: Soil Biology and Biochemistry, 51, 53‒55.
Paya, A.M., Silverberg, J.L., Padgett, J., Bauerle, T.L., 2015, X-ray computed tomography uncovers root-root interactions: quantifying spatial relationships between interacting root systems in three dimensions: Frontiers in Plant Sciences, 6, 274.
Sammartino, S., Michel, E., Capowiez, Y., 2012, A Novel Method to Visualize and Characterize Preferential Flow in Undisturbed Soil Cores by Using Multislice Helical CT: Vadose Zone Journal, 11 (1), vzj2011.0100.
Sauzet, O., Cammas, C., Gilliot, J.M., Bajard, M., Montagne, D., 2017, Development of a novel image analysis procedure to quantify biological porosity and illuvial clay in large soil thin sections: Geoderma, 292, 135‒148.
Schlüter, S., Vogel, H.J., Ippisch, O., Bastian, P., Roth, K., Schelle, H., Durner, W., Kasteel, R., Vanderborght, J., 2012, Virtual soils: assessment of the effects of soil structure on the hydraulic behaviour of cultivated soils: Vadose Zone Journal, 11(4), vzj2011.0174.
Séré, G., Schwartz, C., Ouvrard, S., Sauvage, C., Renat, J.C., Morel, J.L., 2008, Soil construction: a step for ecological reclamation of derelict lands: Journal of Soils and Sediments, 8(2), 130‒136.
Séré, G., Schwartz, C., Ouvrard, S., Renat, J.C., Watteau, F., Villemin, G., Morel, J.L., 2010, Early pedogenic evolution of constructed Technosols: Journal of Soils and Sediments, 10(7), 1246‒1254.
Stoops, G., Marcelino, V., Mees, F., 2010, Interpretation of micromorphological features of soils and regoliths: Amsterdam, Netherlands, Elsevier, 720 p.
Taina, I.A., Heck, R.J., Elliot, T.R., 2008, Application of X-ray computed tomography to soil science: a literature review: Canadian Journal of Soil Science, 88(1), 1‒19.
Tifafi, M., Bouzouidja, R., Leguédois, S., Ouvrard, S., Séré G., 2017, How lysimetric monitoring of Technosols can contribute to understand the temporal dynamics of the soil porosity: Geoderma, 296, 60‒68.
Vogel, H.J., 2008, Morphological determination of pore connectivity as a function of pore size using serial sections: European Journal of Soil Science, 48(3), 365‒377.
Vogel, H.J., Weller, U., Schlüter, S., 2010, Quantification of soil structure based on Minkowski functions: Computers & Geosciences, 36(10), 1236‒1245.
Watteau, F., Séré, G., Huot, H., Begin, J.C., Schwartz, C., Qiu, R., Morel, J.L., 2017, Micropedology of SUITMAs, in Levin, M.J., Kim, K.-H.J., Morel, J.L., Burghardt, W., Charzyński, P., Shaw, R.K., IUSS Working Group SUITMA (eds.), Soils within Cities, Global approaches to their sustainable management: Stuttgart, Germany, Catena Soil Sciences, Schweizerbart Science Publishers, 84‒92.
Wu, K., Van Dijke, M.I.J., Couples, G.D., Jiang, Z., Ma, J., Sorbie, K.S., Crawford, J., Young, I., Zhang, X., 2006, 3D stochastic modelling of heterogeneous porous media – applications to reservoir rocks: Transport in Porous Media, 65(3), 443‒467.
Manuscript received: March 31, 2017.
Corrected manuscript received: October 15, 2017.
Manuscript accepted: October 30, 2017.