
|
Boletín de la Sociedad Geológica Mexicana Volumen 73, núm. 2, A090221, 2021 |
 |
Earthquake ground deformation using DInSAR analysis and instrumental seismicity: The 2019 M 6.0 Mesetas Earthquake, Meta, Colombian Andes
Deformación del terreno usando análisis DInSAR y sismicidad instrumental: El sismo M 6.0 de Mesetas en 2019, Meta, Andes Colombianos
Santiago Noriega-Londoño1,*, Mauricio A. Bermúdez2, Sergio Andrés Restrepo-Moreno3,4,
María Isabel Marín-Cerón1, Helbert García-Delgado5
1 Universidad EAFIT, Departamento de Ciencias de la Tierra, Carrera 49 N° 7 Sur-50, 050021, Medellín, Colombia.
2 Universidad Pedagógica y Tecnológica de Colombia, Escuela de Ingeniería Geológica, Avenida Central del Norte 39-115, 150003, Tunja, Colombia.
3 Universidad Nacional de Colombia, Departamento de Geociencias y Medio Ambiente, Carrera 80 No 65-223, 050034, Medellín, Colombia.
4 University of Florida, Department of Geological Sciences, Gainesville-Florida, 32611,Florida, United States of America.
5 Servicio Geológico Colombiano, Diagonal 53 No. 34 – 53, Bogotá, Colombia.
* Corresponding author: (Noriega-Londoño) This email address is being protected from spambots. You need JavaScript enabled to view it.
How to cite this article:
Noriega-Londoño,S.,Bermúdez,M.A., Restrepo-Moreno,S.A.,Marín-Cerón,M. I., García-Delgado, H., 2021, Earthquake ground deformation using DInSAR analysis and instrumental seismicity: The 2019 M 6.0 Mesetas Earthquake, Meta, Colombian Andes: Boletín de la Sociedad Geológica Mexicana, 73 (2), A090221. http://dx.doi.org/10.18268/BSGM2021v73n2a090221
ABSTRACT
In this contribution, DInSAR analysis, seismic/brittle strain rates, and seismic uplift estimations were used to evaluate ground deformation patterns of the 24 December 2019 Mw 5.8 Mesetas Earthquake that occurred in the Mesetas municipality (Meta, Colombia), on the eastern foothills of Colombian’s Eastern Cordillera, near the Serranía de la Macarena. According to the focal mechanisms computed for this earthquake, the right-lateral Algeciras Fault System was responsible for the rupture event. Primary and secondary SAR images from December 18/2019 and 30/2019, respectively, were used to calculate coseismic ground deformation of the study area. Geocoded line-of-sight (LOS) displacement image suggests that major ground deformation was on the order of 0.2 m for the 24 December discrete seismic event, while the accumulated seismic contribution to surface uplift during 1993 to 2020 reached values of ca. 0.14 m/yr. In contrast, seismic/brittle strain rates and seismic uplift estimations show that this part of South America is currently experiencing deformation at a rate of 4.1×10⁻¹⁶ ± 1.7×10⁻¹⁷s-1 and uplift at a rate of 81.5 ± 3.4 m/Ma during 2018-2020, whereas the deformation was 0.1×10⁻¹⁶ ± 0.2 ×10⁻¹⁷s-1 at a rate of 2.2 ± 0.5 m/Ma between 1993-2018.
Keywords: Interferometry, LOS displacement, seismic strain rate, surface and seismic uplift, Eastern Cordillera, Colombian Andes.
RESUMEN
En este trabajo, utilizamos análisis DInSAR, tasas de deformación sísmica/frágil y estimaciones de levantamiento sísmico para evaluar los patrones de deformación del suelo asociados al terremoto Mw 5.8 Mesetas Earthquake del 24 de diciembre de 2019 que tuvo lugar en el municipio de Mesetas (Meta, Colombia), en las estribaciones orientales del Cordillera Oriental de Colombia, cerca de la Serranía de la Macarena. Según los mecanismos focales calculados para dicho terremoto, el Sistema de Falla de Algeciras, con cinemática lateral-derecha, fue el responsable de este evento de ruptura. Para calcular la deformación co-sísmica del suelo en el área de estudio se utilizaron imágenes SAR maestras y esclavas del 18 y 30 de diciembre de 2019, respectivamente. La imagen geocodificada del desplazamiento de la línea de visión (LOS, por sus siglas en inglés) sugiere que la mayor deformación del suelo fue del orden de 0.2 m para el evento sísmico discreto del 24 de diciembre, mientras que la contribución de la sismicidad acumulada entre 1993 y 2020 alcanzo valores de ca. 0.14 m/año. Por el contrario, las tasas de deformación sísmica/frágil y las estimaciones de elevación sísmica muestran que esta porción del continente Suramericano está experimentando actualmente una deformación a tasas de 4.1×10⁻¹⁶ ± 1.7×10⁻¹⁷ s-1, y levantándose a una tasa de 81.5 ± 3.4 m/Ma durante 2018-2020, mientras que para el período 1993-2018, la deformación fue de 0.1×10⁻¹⁶ ± 0.2 ×10⁻¹⁷ s-1 a una tasa de 2.2 ± 0.5 m/Ma.
Palabras clave: Interferometría, desplazamiento de la LOS, deformación sísmica, levantamiento sísmico superficial, Piedemonte Colombiano, Piedemonte Cordillera Oriental, Andes colombianos.
- Introduction
Over the past thirty years, there has been a significant improvement in the ability to measure ground deformation around fault zones (Tronin, 2010; Elliott et al., 2016). Two technologies are particularly dominant in this field: (1) global navigation satellite systems (GNSS) such as the Global Positioning System (GPS), and (2) Satellite technology, interferometric synthetic aperture radar (InSAR) (Larson, 2009; Elliott et al., 2016). These technologies allow to infer surface motions with millimetric precision, a spatial resolution of a few tens of meters, and without instruments on the ground. Synthetic aperture radar (SAR) images represent the amplitude and phase of the Earth’s surface. While the amplitude is the strength of the radar response and depends on the topographic structure and atmospheric conditions, the phase is a function of the distance between satellites and Earth’s surface (Funning and Garcia, 2019). The differential interferometric synthetic aperture radar technique (DInSAR) consists of the analysis of at least two SAR images to identify phase signal variations and map ground deformation patterns through different acquisition times. Due to this, the DInSAR technique is a useful tool to identify variations on topography associated with seismic events, volcanic activity, and subsidence processes (Massonnet and Feigl, 1998; Crosetto and Crippa, 2005; Ferretti et al., 2007; Bru et al., 2017; Yastika et al., 2018; Merryman, 2019).
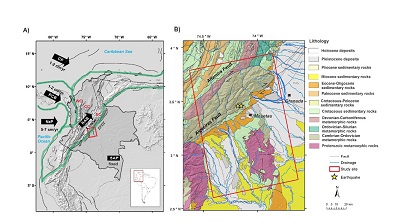
The Nor-Andean Block (NAB) is a major lithospheric block that is being ejected in a NE direction relative to the frame of reference of the South American Plate (Cediel et al., 2003; Egbue and Kellogg, 2010). It sits in the convergence milieu between three major tectonic plates (South America, Nazca and Caribbean) and two other lithospheric blocks, namely, the Panama-Chocó Block and the Maracaibo Block (Figure 1A). It is therefore a region of major crustal discontinuities and hence the source of seismic activity (Paris et al., 2000; Veloza et al., 2012). The Mw 5.8 Mesetas Earthquake (hereafter Mw5.8-ME), focus of the present contribution, took place in the eastern foothills of the Eastern Cordillera and is considered the largest seismic event of the last 20 years in the Colombian Andes (Aguilar and Stein, 2019), underscoring the relative high seismic risk of the region. This portion of the Colombian Andes is dominated by the Algeciras Fault System (AFS), which constitutes a deformation zone separating the NAB and the Amazonian Craton along a regional deformation front of ca. 150 km of length and widths between 25-40 km (Paris et al., 2000; Diederix et al., 2020).
 |
|
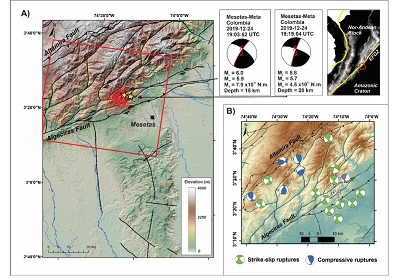
Figure 1. Location and geology of the study site. A) Geotectonic map of Colombia, EC, CC and WC are, respectively the Eastern, Central and Western cordilleras. Arrows indicate the current motion of major tectonic plates (SAP = South America, NZP = Nazca, CP = Caribbean), and lithospheric blocks (PCB = Panama-Chocó Block, NAB = Nor Andean Block, demarcated by green lines). Red square corresponds to the area under study along the Eastern Foothills Deformation Zone (EFDZ). Geodynamic setting from (Taboada et al., 2000; Cediel et al., 2003; Veloza et al., 2012; Mora–Páez et al., 2020). B) Geological map of the study site. Lithology and structures were modified from Gómez-Tapias et al. (2007). |
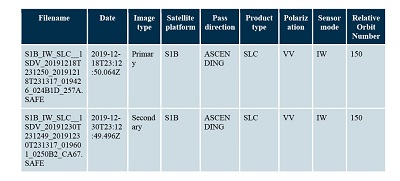
To characterize ground movements due to the Mw 5.8-ME, we used DInSAR analysis from two raw SAR images from the December 18 and 30 2019 (Table 1). We also include parameters derived from instrumental seismicity such as seismic strain rate and seismic energy to estimate the potential contribution of the earthquakes to seismic uplift between 1993 and 2020. Thus, the total uplift should include coseismic surface uplift caused by the vertical deformation of the first 15 kilometers of the crust.
|
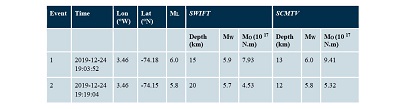
Table 1. Summary of the SAR images metadata used for DInSAR interferometric analysis. |
 |
- Study site
2.1. GEOLOGICAL SETTING
The Eastern Cordillera Basin (ECB) can be neatly described as a Mesozoic extensional basin inverted during the Cenozoic (Sarmiento-Rojas et al., 2006). Backstripping analysis and forward modeling of stratigraphic columns and wells (Eastern Cordillera, Llanos and, Magdalena Basins) carried out by Sarmiento et al., (2006), show that the Mesozoic Colombian Basin was extended by five lithosphere stretching pulses that generated rift basins during the Mesozoic. Plate-margin stresses acting on the proto-ECB help explain much of its Mesozoic tectonic history. During the Early Cretaceous, tensional/transtensional stresses, probably related to backarc extension, produced new episodes of lithosphere stretching and generated a wide system of asymmetric half-rift basins. In addition to their asymmetric character, Triassic rift basins were initially narrow but widened significantly during Jurassic times (Sarmiento, 2011 and reference there in). In contrast, Cretaceous rifts were wider, and less asymmetrical than Triassic counterparts. The western side probably developed by reactivation of an earlier normal fault system inherited from Jurassic rifting. Observable facies lateral change in Mesozoic sediment thickness suggest that the reverse faults that define the eastern and western structural borders of the ECB are largely controlled by former normal faults that were tectonically inverted during the Cenozoic Andean orogeny (Horton et al., 2020; Parra et al., 2009). Their predominately oblique orientation, relative to the Mesozoic magmatic arc of the Central Cordillera, may either be the result of oblique-slip extension during the Mesozoic, or may have been inherited from pre-Mesozoic structures (Sarmiento, 2011 and reference there in).
Surface structural trends tend to have a topographic expression, but their three-dimensional geometry and projection in depth are not fully understood. Reverse faults bound the ECB along its eastern and western borders. In the western margin, low angle, east-dipping thrust faults parallel to the mountain front, extend into the Middle Magdalena Basin (MMB) at a 20 ̊ angle. These thrust faults include splays that transfer their slip to north-plunging anticlines and are arranged into an en-echelon. The Llanos foothills structural domain (Velandia et al., 2005; Martinez, 2006; Sarmiento-Rojas, 2011) is an external zone of the ECB where both Cretaceous and Cenozoic (Palaeogene and Neogene) sedimentary rocks are cropping out along low-angle thrust and fold belt. Structural styles identifiable today in that domain are dominated by thin-skinned thrusts detaching from Late Cretaceous to Early Cenozoic sections, and developed during the Andean orogeny (e.g., Velandia et al., 2005; Martinez, 2006; Parra et al., 2009; Sarmiento-Rojas, 2011). In that area it is possible to recognize inverted normal faults that are now reverse or imbricate thrust faults in addition to local triangle zones with duplexes of the Algeciras Fault System (AFS).
The AFS constitutes the main part of the southern half of the transform belt system in Colombia and covers the length of the system between the village of La Uribe in the northeast, where the main branch of the system crosses the Eastern Cordillera, and the town of Sibundoy in the southwest not far from the town of Mocoa, on the way passing the towns of Garzón, Timaná, and Pitalito. South of the town of Sibundoy the fault continues as the Afiladores Fault into Ecuador (Diederix et al, 2020). This structure produces an outstanding morphological expression on the DEM and also on aerial photos that compare with the well–documented Boconó Fault in Venezuela. The width of the fault belt of the AFS varies in this sector between 25 and 40 km. The AFS obliquely traverses the entire width of the Eastern Cordillera to the point that it this merges with the Central Cordillera. In-between these two branches, the Paleozoic Quetame Massif has been wedged (Diederix et al., 2020).
The AFS stretch of the transform belt in Colombia covers a distance of 330 km and constitutes a series of interconnected and anastomosing faults, the central and most important branch of which is the Algeciras Fault proper. Particularly in the sector between the village of Algeciras in the north and Pitalito in the south, most of the movement of the fault system is concentrated along this main branch. The entire system between La Uribe, where the main branch of Algeciras Fault enters the Eastern Cordillera coming in from the Llanos Orientales, to Pitalito, the fault traverses obliquely the entire width of the Eastern Cordillera to the Central Cordillera. In this sector, the fault constitutes a large part of the western boundary of the Neoproterozoic Garzón Massif (Velandia et al., 2005; Mora et al., 2010; Veloza et al., 2012).
The AFS is assumed as the seismogenic source (along the active mountain belts of the Nor-Andean Block and the Amazon craton, e.g., Taboada et al., 2000; Velandia et al., 2005) (Figure 2). These eastern foothills mark the west to east-northeast migration of the entire frontal fault system. The deformation front of the AFS show a NE-SW strike and right-lateral displacement, represents a potential zone for high strain accumulation and release of energy in the form of seismic events, suggesting a critical regional seismogenic source (Paris et al., 2000; Veloza et al., 2012; Chicangana et al., 2013; Muñoz-Burbano et al., 2015). This relation underlines the significance of a fundamental role in the geodynamics of the northern Andes (Figure 1).
2.2. THE 2019 MESETAS EARTHQUAKE
The Mw5.8-ME occurred at 19:03:52 hours (UTC) in 2019 with ML 6.0 in the Mesetas municipality, Meta Department in central Colombia (Figure 1B). This event was followed by an aftershock at 19:19:04 hours (UTC), with an Mw 5.7 (ML 5.8) (Servicio Geológico Colombiano, SGC, 2020a). Depths for these seismic events were calculated at ~13 and ~12 km, respectively, indicating upper crustal energy liberation related to the Colombian foothills on the eastern flank of the Eastern Cordillera’s fault systems, and specifically to the Algeciras deformation zone (Servicio Geológico Colombiano SGC, 2019). Aftershocks followed during few days making the Mw5.8-ME one of the most significant earthquakes in the area for the last 20 years (Aguilar and Stein, 2019). The Mw5.8-ME was reported in the main urban settlements without important effects on infrastructure and/or on human lives (Servicio Geológico Colombiano SGC, 2019). However, environmental impacts, e.g., coseismic landsliding, were reported (Servicio Geológico Colombiano SGC, 2020). In Bogotá, ~150 km away from the epicenter, the main shock was reported as a IV-V seismic event in the Mercalli intensity scale, while in the Mesetas town plaster fracture occurred in several buildings (Aguilar and Stein, 2019).
Historically, the region possesses a record of seismic events in the years 1785, 1827, 1917- and 1967 affecting cities such as Bogotá (Ramírez, 1975; Muñoz-Burbano et al., 2015; Ramírez, 1975; Diederix et al., 2020). In the field, the morphotectonic expression of the primary traces are well defined with aligned fault valleys, scarp inversion, hanging valleys, linear ridges, sag ponds, including displacement and deformation of late Pleistocene deposits at a rate of 1-5 mm/yr (Paris et al., 2000).
- Methodology
In this study, we deployed a combination of techniques to address seismicity (e.g. focal mechanisms, seismic energy, seismic strain rates, etc.) and surface deformation (e.g., DInSAR interferometry) that will be discussed in this section.
3.1. SEISMICITY DATABASE
3.1.1. SEISMICITY DATABASE
To estimate the faulting mechanics and the geometry and kinematic of the displacements related to the Mw 5.8-ME events, we evaluate their focal mechanism and associated parameters such as nodal planes and principal axes. Basic instrumental seismicity information, including local magnitude and geographic coordinates of the two main earthquake events, was obtained from the Red Sísmica Nacional de Colombia Earthquake Catalog (RSNC, https://bdrsnc.sgc.gov.co/paginas1/catalogo/). We choose the RSNC data over other catalogs due to two reasons. First, a total of 23 seismological stations are located around the study area. Most of the stations were installed after 2010, and a few stations have data from 1992 to the present. These stations have sufficient sensitivity to detect earthquakes from 1.0 magnitude. Seismic deformation is significant including earthquakes of magnitudes 2 to 3 on the Richter scale. And second, there is no good coverage of United States Geological Survey (USGS) stations throughout the study area. Unfortunately, the network in the vicinity of the study area is very new, and we were only able to work with a record spanning 17 years (1993-2020).
The focal mechanism and the moment tensor of the Mw 5.8-ME was obtained from the RSNC application (https://bdrsnc.sgc.gov.co/sismologia1/sismologia/focal_seiscomp_3/index.html) using the SWIFT and SCMTV methodologies (Minson and Dreger, 2008; Nakano et al., 2008).
In order to determine the seismic strain rate, we need to know the magnitude of each event. Although a variety of magnitude scales have been used by different agencies across the world, our preferred magnitude M is the local magnitude since this is the way the Colombian Geological Survey national network catalog reports the events. The criterion used for the selection of the spatial extent of seismic events was to consider a radius of 300 km around the study area. The catalog was not resampled, but we divided the study area in powers of 4n provided that for each quadrant there were more than 20 earthquakes, a way to analyze the behavior of parameters a and b. We tested the effects for different values of a, b, Mmax (between 4.6 and 6.0). However, no significant disparities were found for the different partitions nor the diverse values used. Finally, an Mmax of 6.0 Magnitude was used in agreement with the event of 12/24/2019; at 3.46 km of depth. Although, the depth of the earthquakes ranges from 0 to ~90 km, we only considered a maximum depth of 15 km, for reasons that will be discussed in the following sections. According to the USGS seismic catalog in the vicinity of the studied window, there are different events of magnitude greater than 4 (at least 40 earthquakes from 1974 to the present), among these events the following are noteworthy: 2016/16/12 Magnitude 4.5, depth 61.75 km located at 25 km of Mesetas, Colombia, 2017/02/07, magnitude 5.1, depth 27.64 km, and the deepest (86 km) in 1974/08/12 with a magnitude of 4.6.
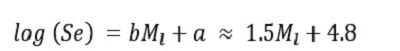
3.1.2. SEISMIC ENERGY
Using the seismicity database, we calculated the Seismic Energy (Se) from the local magnitudes using the classical expression (Gutenberg and Richter, 1954):
 |
(1) |
This power-law model involves two parameters: the a-value, which measures the seismic activity or earthquake productivity, and the b-value, describing the relation between frequencies of small and large earthquakes (Schorlemmer et al., 2005; Cheng and Sun, 2018).
The parameters a and b were estimated by a least-squares fit of cumulative magnitude-frequency relationship and are equivalent to the intercept and slope, respectively, of the Gutenberg-Richter relationship (Gutenberg and Richter, 1954). We subsampled the seismic database across each district in 0.05º×0.05º cells to calculate the seismic energy.
3.1.3. SEISMIC STRAIN RATE
Seismicity records brittle deformation for the upper crust and is related to the distribution and frequency of earthquakes (Holt et al., 2000). We used the compiled seismic database to estimate the present-day distribution of brittle strain rate and extrapolate the total amount of seismic strain over timescales longer than the observation interval, using the observed earthquake magnitude-frequency (Gutenberg-Richter) relationship. To achieve this, we used the method described by Braun et al. (2009) and calculated seismic/brittle strain rate as:
 |
(2) |
in which the parameters a and b are derived from the Guttenberg-Richter relationship; Mmax is the maximum observed magnitude; μ is elastic shear modulus; ΔV is the volume of the crust (that is, the moving 0.05º×0.05º cell area multiplied by the depth of the maximum magnitude earthquake) in which the earthquakes were observed over a period Δt (in this case, Δt = 27 years). The depth of the maximum magnitude earthquakes (30-100 km) generally exceeds the depth of brittle-ductile transition (~15-20 km), therefore we restricted our calculation of seismic strain rates to earthquakes with hypocentral depths of less than 15 km.
3.1.4. SEISMIC UPLIFT
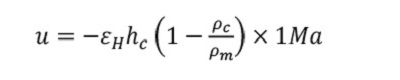
We define the seismic uplift u, as the amount of vertical thickening of the chain that generates a positive topography (that includes rock or surface uplift, see England and Molnar, 1990) predicted from the seismic energy release measured over the interval between 1993 and 2020 and extrapolated over the past 1 Ma; assuming that the current state of compression is accommodated by the study area during this time.
The computed vertical strain can then be used to compute the local lithospheric thickening, and, by assuming local isostatic equilibrium, the amount of seismic uplift, u, experienced by each cell-size over the last 1 Ma is:
 |
(3) |
In this last expression, hc is crustal thickness given by the CRUST1.0 model (Bassin et al., 2000; Laske et al., 2013), ρc (2700 kg m-3) and ρm (3200 kg m-3) are average continental crustal and mantle rock densities, respectively. We use these cortical densities by choosing the average for the study area from the CRUST 1.0 model (Bassin et al., 2000; Laske et al., 2013). For mantle density in the study area, different authors use this same average values for sectors of the Eastern Cordillera of Colombia and the Venezuelan Andes (Gómez et al., 2005; Bermudez et al., 2011; 2021).
Obtained data were then processed by ArcGIS v.10.5 platform to provide final maps of the analyzed parameters. All values were summed within circles with a radius of 2.5 km around the epicenter of each earthquake smoothing the final results. We tested different radii to present the maps, small radii tend to give a zone of anomaly that is distinguishable as pixels, while large radii (i.e., > 5 km) tend to yield a single surface of high seismic uplift. For this reason and seeking a balance to show the uplift of the zone our preferred radius was 2.5 km.
3.2. DINSAR INTERFEROMETRY
Our approach to quantify surface deformation associated with to the Mw 5.8-ME events, implies the use of DInSAR analysis from two raw satellite images that bracket the event: one from December 18 and another from December 30, 2019. SAR images from the Sentinel-1 satellite were download from the Copernicus Open Access Hub (https://scihub.copernicus.eu/dhus/#/home). We selected two SAR-C images corresponding to the available dataset in the SAR images catalog, traying to capture conditions before and after the primary seismic wave. Details on the selected images are shown in Table 1. A reference interferogram image or topographic interferogram (i.e., phase parameter) was obtained from the co-registration process of the two raw images using the SNAP toolbox version 7.0.0 (http://step.esa.int/main/download/snap-download/). We used an ALOS PALSAR digital elevation model (DEM) with a 12.5 m spatial resolution to process the interferogram image and to build a wrapped phase image and apply terrain correction. This DEM was acquired from the Alaska Satellite Facility (https://search.asf.alaska.edu/#/). Coherence values after unwrapping the interference image were used to verify the quality of the derived phase image. Before getting a geocoded LOS displacement image of the Mw5.8-ME, we unwrapped the phase image using SNAPHU software version v1.4.2 (Chen and Zebker, 2002). More details in the employed methodology could be found on Ferretti et al. (2007).
- Results
4.1. FOCAL MECHANISMS AND EARTHQUAKE PARAMETERS
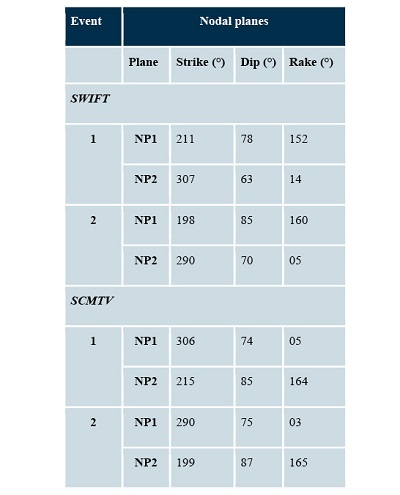
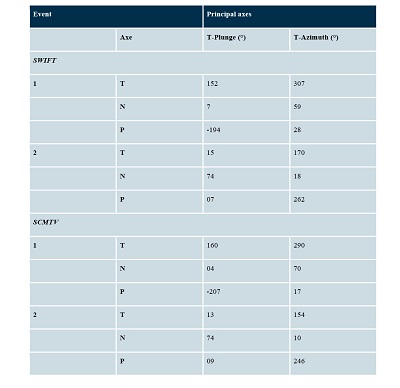
Earthquake parameters for the Mw5.8-ME derived from the focal mechanisms are shown in Table 2. Focal mechanisms obtained exhibit a strong strike-slip fault displacement component and are shown in Figure 2. For each seismic event, we generated nodal planes and principal axes by utilizing two methods: the SWIFT and SCMTV. These results are shown in Tables 3 and 4. The Mw5.8-ME showed two nodal planes with strike 211° and 307°, dips of 78° and 63°, and rake values of 152° and 14°. Also, the Mw 5.8 event showed nodal planes with strikes of 198° and 290°, dips of 85° and 70° and rake values of 160° and 05°. Estimations for the principal axes on the first seismic event (Mw 5.8-ME) suggest tension axis (T) orientation ranging from 307°/152° to 290°/160°, while the pressure axis (P) trends vary between 28°/-194° and 17°/-207°. For the second event (Mw 5.8-ME) T and P axis show values ranging from 170°/15° to 154°/13°, and 262°/07° to 246°/09°, respectively. These results indicate that both earthquakes were related to strain fields where the compressional vectors show NNE and ENE azimuth and associated nodal planes of N18°-35°E strike, sub-vertical dips and high rake values which are all consequent with a right-lateral strike-slip fault displacement.
 |
|
Figure 2. Instrumental seismicity of the Mesetas-Meta region. A) Location of the December 24, 2019, Mesetas earthquake. Main range oriented in a NE direction corresponds to the eastern flank of the Eastern Cordillera. Range oriented NS corresponds to the Serranía de la Macarena. Seismic stations are shown as white triangles. Focal mechanisms and seismic parameters are also indicated for both events. B) Details of the focal mechanisms founded in the surroundings of the Mesetas earthquake during 1993-2020. Faults and focal mechanisms were obtained from the Colombian Geological Survey. |
|
Table 2. Results from the focal mechanism, depth and moment tensor analysis from the SWIFT and SCMTV method. |
 |
Rapid inspection of focal mechanisms available from other authors (e.g., Suarez et al., 1983; Salcedo-Hurtado et al., 2001; RSNC, USGS Earthquake Hazard Program, and the Catalog of Focal Mechanisms and Moment Tensor from the SGC (http://bdrsnc.sgc.gov.co/sismologia1/sismologia/focal_seiscomp_3/index.html) support our interpretations of the Mw 5.8-ME event (Figure 2). In the faulted block between the reverse Altamira Fault System and the Algeciras Fault, most mechanisms vary from strike-slip ruptures (green-colored beach balls) and compressive ruptures (blue-colored beachballs). For six out of 17 focal mechanisms, that corresponds to seismic events before the December 2019 earthquake, an average P axis of 255.13° with a dip of 11.25° was computed. These results match the expected NNE horizontal compressive axis for the region. Of the remaining 11 focal mechanisms, 9 are aftershocks from the December 2019 event. The P axis for these aftershocks varies from 84° to 153°, with an average of 99.7°. The T axis trend for these aftershocks is dominant to the SSW or NNW.
|
Table 3. Results from the nodal planes using the SWIFT and SCMTV methods. |
 |
|
Table 4. Results from the principal axes using the SWIFT and SCMTV methods. |
 |
4.2. SEISMIC DEFORMATION RATES
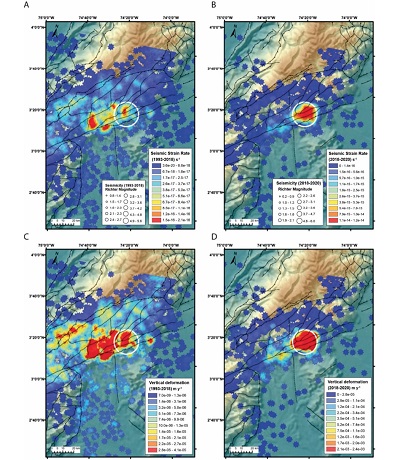
Results for seismic deformation rates, seismic energy distribution and earthquake´s contribution to vertical displacement for a time-lapse between 1993 and 2018, and 2018-2020, respectively, are shown in Figures 3 and 4. Seismic/brittle strain rates on the Mesetas area show values 1.10 x10⁻¹⁷ ± 2.40 x10⁻¹⁸, and 4.13 x10⁻¹⁶ ± 1.75 x10⁻¹⁷ s-1 for the 1993-2018, and 2018-2020 intervals, respectively. Seismic energy results range from 11058.58 ± 18705.52 J in 1993-2018 to 10220.62 ± 110821.40 J between 2018 and 2020. Finally, seismic uplift estimations varied from 2.18 ± 0.47 m/Ma in 1993-2018 periods to 81.48 ± 3.44 m/Ma in 2018-2020.
 |
|
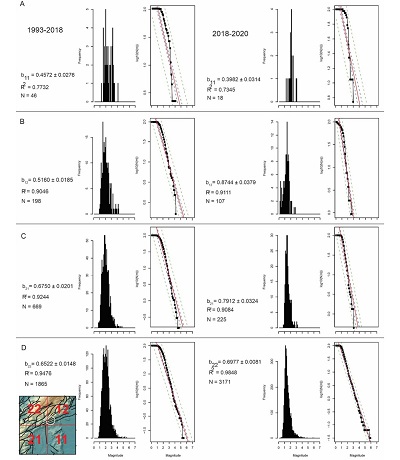
Figure 3. Relationship magnitude-frequency for earthquakes presented in the study area between years intervals 1993-2018 (left column), and 2018-2020 (right column). Letter b corresponds to the b-value, and N indicates the number of earthquakes for each period. Labeled frames correspond to the quadrant segmentation shown down left. Subscript numbers next to the b-values refer to the specific quadrant, e.g., b11 = b-value for quadrant 11. |
 |
|
Figure 4. Comparisons between seismic/brittle strain rates and seismic uplift across the study area for the periods A) 1993-2018 and B) 2018-2020, with 106 and 2583 events respectively. The white circle corresponds to the Mesetas area. Note how the both Strain and Vertical Deformation become significantly concentrated around the Mesetas Area for the 2018-2019 showing the expected coherence between both parameters. If, for instance, vertical displacement where due to atmospheric and/or vegetation, then the distribution of data should follow no specific spatial or temporal trend. |
4.3. DINSAR INTERFEROMETRY
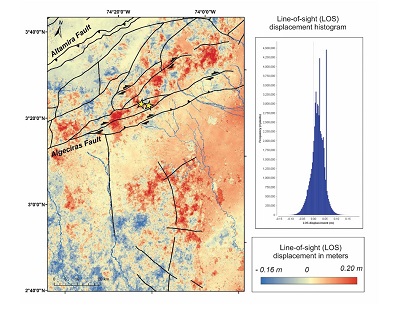
Wrapped interferogram radar image appears as an ambiguous interferogram (Funning and Garcia, 2019) where the strength and direction of motion are not directly recognized. This is also shown in the coherence values, which range from 0.0 to 0.9, and could be associated with the dense vegetation cover of the study site or atmospheric influence. Obtained range of LOS displacement values vary between -0.16 and 0.20 m (Figure 5).
The geocoded LOS displacement values close to zero concentrate in the mountainous region, while values from 0.02 to 0.5 meters are distributed across lowland areas indicating a response of the surface according to the local geological environment and the structural network. Also, the higher LOS displacement values concentrate in the deformation zone along the foothills, highlighting the deformation through the active fault traces that separate the two main geomorphologic and tectonic domains, i.e., mountain ranges to the west and lowlands to the east. In contrast, the south portion of the study area shows a segmented differential surface uplift along the Serranía de la Macarena (Figure 5).
 |
|
Figure 5. Line-of-sight (LOS) displacement interferometric image and associated histogram. Note that vertical displacement concentrates areas of positive uplift along the Algeciras Fault trace. |
- Discussion and conclusions
Integrated instrumental seismicity and DInSAR analysis provided a complete assessment of recent deformation on the Colombian Eastern Foothills and the seismic behavior of the Algeciras Fault System for specific locales around the Mesetas municipality. Calculated focal mechanisms by SWIFT and SCMTV methodologies, and for the two selected seismic events that occurred during the Mw 5.8-ME (Mw 5.8 and Mw 5.7), indicate a nodal plane with strikes varying between 198° and 211°, dips more than 60° and rake values ranging between 05° and 14°. Also, the spatial distribution of the tension (T) and pressure (P) axis is coherent with the regional trend of the Algeciras Fault System, which exhibits a right-lateral kinematic along its principal deformation zone (Velandia et al., 2005) with N18°-35°E, subvertical dipping and shallow seismogenic faults. Both the focal mechanism computed in this work and the catalog from other sources are indicative of the transpressive nature of the stress regime that characterizes the study area. Based on the seismotectonic map (Figure 2), we interpret a positive, asymmetric flower structure with the Algeciras Fault System as the main structure which is consistent with seismic lines on the area (Sarmiento-Rojas, 2011). Also, other authors showed similar behavior along some parts of the Eastern Foothills (Velandia et al., 2005; Acosta et al., 2007; Diederix et al., 2020). On the upthrown faulted block, the Altamira Fault and other subsidiary structures accommodate strain partitioning through reverse faulting, whereas the Algeciras Fault is mainly right-lateral in kinematics, as the Mw5.8-ME events suggest.
Before the Mw 5.8-ME we observe low b-values ranging from ca. 0.4572 to 0.67.50 with the largest values occurring in the NAB, i.e., quadrants 21 (SW) and 12 (NE), which follow the trace of the Algeciras Fault System (Figure 3). After the earthquakes, b-values increase significantly from ca 0.8744 (quadrant 12) to 0.7912 (quadrant 21), possibly as a result of aseismic slip (Senatorski, 2020). It is interesting to note that the Mesetas area, where the highest values for Seismic Strain Rate and Vertical Deformation during the period 2018-2020 are found, lies right at the intersection between the Eastern Cordillera foothills and the older topographic feature of the Serranía de la Macarena. It remains to be documented if the apparent indentation of the latter on the main structures and topographic structures of the Eastern Cordillera increases friction at this particular segment, a condition that may, in turn, induce fault locks that are then released in the form of earthquakes.
Along the major crustal structures in the area, the decadal seismic deformation rates indicate interseismic creep behavior of the shear zone with a differential response of the lithology on both sites of the foothills. While the northwestern Garzón Massif (crystalline rocks) in the mountainous region show relatively low values of released seismic energy, the southeastern lowlands, where Late Cenozoic sedimentary sequences and unconsolidated deposits dominate, exhibit higher values.
Ground deformation related to the Mw 5.8 and Mw 5.7 seismic events of the Mw 5.8-ME derived from DInSAR analysis show LOS displacement ranging between -0.16 and 0.20 m. Such values are consistent with the decadal seismic energy released and the spatial distribution of the seismic contribution to surface uplift, which exhibits values on the range of 3.6 to 140.6 mm/yr. DInSAR analyses may also indicate the local effect of vegetation cover derived from coherence values and the ambiguous interferographic phase (Funning and Garcia, 2019), but, our seismic analysis results highlight fault displacement at seismic rates of the order of 10-16 s1, which are consistent with intraplate strike-slip faults (Kreemer et al., 2014; Fagereng and Biggs, 2019).
These data provide a preliminary perspective on the seismic behavior of the Mesetas region indicating progressive surface uplift concentrated along this segment of the Algeciras Fault System and demonstrating the potential ground response of the lowland vs. the crystalline massifs due to local geological effects and high relative relief, which control aftershock mass movements (García-Delgado et al., 2021). Local geodetic measurements and paleo-seismological analysis are needed to constraint recent and past deformation history of this segment of the Eastern Foothills Deformation Zone in order to improve neotectonics knowledge and seismic risk assessment.
In conclusion, focal mechanisms form the Mw5.8-ME relate to the geometry and kinematic of minor structures associated with the AFS, where the decadal ground deformation ranges between 3.6 to 140.6 mm/yr. Finally, we emphasize the use of DInSAR techniques as a tool for assessing mapping of surface rupture and active structures.
Acknowledgements
This project was supported with a grant by the Administrative Department of Science, Technology and Innovation (COLCIENCIAS) and the Foundation for the Future of Colombia Colfuturo (COLFUTURO), project number 201820001205 (S. Noriega). M. Bermúdez thanks the financial support provided under the project DIN-SGI-3104 of the Universidad Pedagógica and Tecnológica de Colombia (UPTC).
References
Acosta, J., Velandia, F., Osorio, J., Lonergan, L., Mora, H., 2007, Strike-slip deformation within the Colombian Andes: Geological Society, London, Special Publications, 272(1), 303–319. https://doi.org/10.1144/GSL.SP.2007.272.01.16
Aguilar, A., Stein, R., 2019, Largest Colombian crustal earthquake in 50 years strikes on Christmas Eve. Available at: <https://temblor.net/earthquake-insights/terremoto-cortical-mas-grande-de-los-ultimos-50-anos-en-colombia-golpea-en-navidad-10273/>. Reviewed in June/2020.
Bassin, C., Laske, G., Masters, G., 2000, The current limits of resolution for surface wave tomography in North America. Eos, Transactions American Geophysical Union.
Bermudez, M. A., van der Beek, P., Bernet, M., 2011, Asynchronous Miocene-Pliocene exhumation of the central Venezuelan Andes: Geology, 39(2), 139–142. https://doi.org/10.1130/G31582.1
Bermúdez, M. A., Velandia, F., García-Delgado, H., Jiménez, D., Bernet, M., 2021, Exhumation of the southern transpressive Bucaramanga fault, eastern Cordillera of Colombia: Insights from detrital, quantitative thermochronology and geomorphology: Journal of South American Earth Sciences, 106, 103057. https://doi.org/10.1016/j.jsames.2020.103057
Braun, J., Burbidge, D. R., Gesto, F. N., Sandiford, M., Gleadow, A. J. W., Kohn, B. P., Cummins, P. R., 2009, Constraints on the current rate of deformation and surface uplift of the Australian continent from a new seismic database and low-T thermochronological data: Australian Journal of Earth Sciences, 56 (2), 99-110. https://doi.org/10.1080/08120090802546977
Bru, G., González, P. J., Mateos, R. M., Roldán, F. J., Herrera, G., Béjar-Pizarro, M., Fernández, J., 2017, A-DInSAR monitoring of landslide and subsidence activity: A case of urban damage in Arcos de la Frontera, Spain: Remote Sensing, 9(8), 787. https://doi.org/10.3390/rs9080787
Cediel, F., Shaw, R. P., Cáceres, C., 2003, Tectonic assembly of the Northern Andean block, in Bartolini,C., Buffler, R. T., Blickwede, J., The Circum-Gulf of Mexico and the Caribbean: Hydrocarbon habitats, basin formation, and plate tectonics: AAPG Memoir 79, 815-848.
Chen, C. W., Zebker, H. A., 2002, Phase unwrapping for large SAR interferograms: Statistical segmentation and generalized network models: IEEE Transactions on Geoscience and Remote Sensing, 40(8), 1709-1719. https://doi.org/10.1109/TGRS.2002.802453
Cheng, Q. M., Sun, H. Y., 2018, Variation of singularity of earthquake-size distribution with respect to tectonic regime: Geoscience Frontiers, 9(2), 453-458. https://doi.org/10.1016/j.gsf.2017.04.006
Chicangana, G., Vargas-Jiménez, C. A., Caneva, A., 2013, El posible escenario de un sismo de magnitud ≥ 6,5 para la ciudad de Villavicencio (Colombia): Cuadernos de Geografía: Revista Colombiana de Geografía, 22(2), 171-190. https://doi.org/10.15446/rcdg.v22n2.30166
Crosetto, M., Crippa, B., 2005, State of the art of land deformation monitoring using differential SAR interferometry. In ISPRS Workshop, Hannover, Germany.
Diederix, H., Bohórquez, O. P., Mora–Páez, H., Peláez, J. R., Cardona, L., Corchuelo, Y., Ramírez, J., Díaz–Mila, F., 2020, The Algeciras Fault System of the Upper Magdalena Valley, Huila Department. In The Geology of Colombia. Servicio Geológico Colombiano. Publicaciones Geológicas Especiales, 38, 423–452.
Egbue, O., Kellogg, J., 2010, Pleistocene to Present North Andean “escape.”:Tectonophysics, 489 (1–4), 248–257. https://doi.org/10.1016/j.tecto.2010.04.021
Elliott, J. R., Walters, R. J., Wright, T. J., 2016, The role of space-based observation in understanding and responding to active tectonics and earthquakes: Nature Communications, 7, 13844. https://doi.org/10.1038/ncomms13844
England, P., Molnar, P., 1990, Surface uplift, uplift of rocks, and exhumation of rocks: Geology 18(12), 1173–1177. https://doi.org/10.1130/0091-7613(1990)018<1173:SUUORA>2.3.CO
Ferretti, A., Monti-Guarnieri, A., Prati, C., Rocca, F., Massonnet, D., 2007, InSAR Principles: Guidelines for SAR Interferometry Processing and Interpretation. In ESA Publications. Avaible at; < https://www.esa.int/About_Us/ESA_Publications/InSAR_Principles_Guidelines_for_SAR_Interferometry_Processing_and_Interpretation_br_ESA_TM-19 >.
Funning, G. J., Garcia, A., 2019, A systematic study of earthquake detectability using Sentinel-1 InterferometricWide-Swath data: Geophysical Journal International, 216(1), 332-349. https://doi.org/10.1093/gji/ggy426
Gómez, E., Jordan, T. E., Allmendinger, R. W., Hegarty, K., Kelley, S., 2005, Syntectonic Cenozoic sedimentation in the northern middle Magdalena Valley Basin of Colombia and implications for exhumation of the Northern Andes: Geological Society of America Bulletin, 117(5–6), 547–569. https://doi.org/10.1130/B25454.1
Gómez, J., Nivia, A., Montes, N., Jiménez, D., Tejada, M. L., Sepúlveda, M., Osorio, J., Gaona, T., Diederix, H., Uribe, H., Mora, M., 2007, Mapa Geológico de Colombia, escala 1:2.800.000. Ingeominas.
Gutenberg, B., Richter, C. F., 1954, Seismicity of Earth and Associated Phenomenon, Princeton University Press, Princeton, 310 p.
Holt, W. E., Chamot-Rooke, N., Le Pichon, X., Haines, A. J., Shen-Tu, B., Ren, J., 2000, Velocity field in Asia inferred from Quaternary fault slip rates and Global Positioning System observations: Journal of Geophysical Research Solid Earth, 105(B8), 19185-19209. https://doi.org/10.1029/2000jb900045
Larson, K. M., 2009, GPS seismology: Journal of Geodesy, 83, 227–233. https://doi.org/10.1007/s00190-008-0233-x
Laske, G., Masters, G., Ma, Z., Pasyanos, M., 2013, Update on CRUST1.0---A 1-degree global model of Earth’s crust. EGU General Assembly 2013 in Vienna, Austria.
Massonnet, D., Feigl, K. L., 1998, Radar interferometry and its application to changes in the earth’s surface: Reviews of Geophysics, 36(4), 441-500. https://doi.org/10.1029/97RG03139
Merryman, J. P., 2019, Measuring coseismic deformation with spaceborne synthetic aperture radar: A review: Frontiers in Earth Science, 7, 16. https://doi.org/10.3389/feart.2019.00016
Minson, S. E., Dreger, D. S., 2008, Stable inversions for complete moment tensors: Geophysical Journal International, 174 (2), 585-592. https://doi.org/10.1111/j.1365-246X.2008.03797.x
Mora–Páez, H., Kellogg, J. N., Freymueller, J. T., 2020, Contributions of space geodesy for geodynamic studies in Colombia: 1988 to 2017: The Geology of Colombia, Vol. 4 Quaternary. Servicio Geológico Colombiano, Publicaciones Geológicas Especiales 38, 479–498.
Mora, A., Parra, M., Strecker, M. R., Sobel, E. R., Zeilinger, G., Jaramillo, C., Da Silva, S. F., Blanco, M., 2010, The eastern foothills of the eastern cordillera of Colombia: An example of multiple factors controlling structural styles and active tectonics: Bulletin of the Geological Society of America, 122, 11-12. https://doi.org/10.1130/B30033.1
Muñoz-Burbano, F. J., Vargas-Jiménez, C. A., Chicangana, G., 2015, Seismicity in colombian llanos foothills: Characterization, relocation and local seismic tomography: Boletín de Ciencias de La Tierra, 38, 14-24. https://doi.org/10.15446/rbct.n38.45681
Nakano, M., Kumagai, H., Inoue, H., 2008, Waveform inversion in the frequency domain for the simultaneous determination of earthquake source mechanism and moment function: Geophysical Journal International, 173(3), 1000-1011. https://doi.org/10.1111/j.1365-246X.2008.03783.x
Paris, G., Machette, M. N., Dart, R. L., Haller, K. M., 2000, Map and Database of Quaternary Faults and Folds in Colombia and its Offshore Regions. USGS, 66 p.
Ramírez, J. E., 1975, Historia de los Terremotos en Colombia, in Codazzi, I. G. A., (Ed.). Instituto Geográfico Agustín Codazzi.
Salcedo-Hurtado, E., Rivera, C., Gómez Capera, A., 2001, Implicaciones sismotectónicas de las soluciones mecanismo focal de algunos terremotos de la región central de Colombia: Earth Sciences Research Journal, 5, 18-26.
Sarmiento-Rojas, L. F., 2011, Geology and hydrocarbon potential Llanos basin. In: Cediel, F., and Ojeda, G. Y. (Eds.). Petroleum geology of Colombia. Volume 9: Medellin, ANH, Fondo editorial Universidad Eafit, 17-184.
Sarmiento-Rojas, Van, W., Cloetingh, S., 2006, Mesozoic rifting and Cenozoic basin inversion history of the eastern cordillera, Colombian Andes - Inferences from tectonic models: Journal of South American Earth Sciences, 21(4),383-411. https://doi.org/10.1016/j.jsames.2006.07.003
Schorlemmer, D., Wiemer, S., Wyss, M., 2005, Variations in earthquake-size distribution across different stress regimes: Nature, 437, 539-542. https://doi.org/10.1038/nature04094
Senatorski, P., 2020, Gutenberg–Richter’s b Value and Earthquake Asperity Models: Pure and Applied Geophysics, 177, 1891-1905. https://doi.org/10.1007/s00024-019-02385-z
Servicio Geológico Colombiano (SGC), 2019, Boletín de Sismos: diciembre de 2019. https://www2.sgc.gov.co/Publicaciones/Paginas/boletines-sismicidad.aspx
Servicio Geológico Colombiano (SGC), 2020, Informe de visita técnica a los municipios de Lejanías y Mesetas (Meta), debido a los movimientos en masa detonados por el sismo del 24 de diciembre de 2019.
Suarez, G., Molnar, P., Burchfiel, B. C., 1983, Seismicity, fault plane solutions, depth of faulting, and active tectonics of the Andes of Peru, Ecuador, and southern Colombia: Journal of Geophysical Research, 88(B12), 10403-10428. https://doi.org/10.1029/JB088iB12p10403
Taboada, A., Rivera, L. A., Fuenzalida, A., Cisternas, A., Philip, H., Bijwaard, H., Olaya, J., Rivera, C., 2000, Geodynamics of the northern Andes: Subductions and intracontinental deformation (Colombia): Tectonics, 19(5), 787–813. http://onlinelibrary.wiley.com/doi/10.1029/2000TC900004/full
Tronin, A. A., 2010, Satellite remote sensing in seismology. A review: Remote Sensing,2( 1), 124-150. https://doi.org/10.3390/rs2010124
Velandia, F., Acosta, J., Terraza, R., Villegas, H., 2005, The current tectonic motion of the Northern Andes along the Algeciras Fault System in SW Colombia: Tectonophysics, 399 (1-4), 313-329. https://doi.org/10.1016/j.tecto.2004.12.028
Veloza, G., Styron, R., Taylor, M., 2012, Open-source archive of active faults for northwest South America: GSA Today, 22(10), 4–10. https://doi.org/10.1130/GSAT-G156A.1
Yastika, P. E., Ibara, T., Shimizu, N., Iwata, N., Takahashi, Y., Araki, Y., 2018, Application of dinsar for monitoring the ground deformation due to volcanic activity: A case study of Sakurajima, Japan. ISRM International Symposium - 10th Asian Rock Mechanics Symposium, ARMS 2018.
Manuscript received: August 31, 2020
Corrected manuscript received: January 20, 2021
Manuscript accepted: February 9, 2021