
|
Boletín de la Sociedad Geológica Mexicana Volumen 73, núm. 1, A151220, 2021 |
 |
Reservoir quality and petrophysical evaluation of the Paleocene paralic sandstones in the Ranchería sub-basin, Colombia
Calidad del reservorio y evaluación petrofísica de las areniscas parálicas del Paleoceno en la subcuenca de Ranchería, Colombia
Álvaro Alejandro Villar1,*, Edwar Herrera2
1 Geology School, Universidad Industrial de Santander (UIS), Carrera 27 Calle 9 Ciudad Universitaria, Bucaramanga, 680002, Colombia.
2 Petroleum Engineering School, Universidad Industrial de Santander (UIS), Carrera 27 Calle 9 Ciudad Universitaria, Bucaramanga, 680002, Colombia.
* Corresponding author: (A. A. Villar) This email address is being protected from spambots. You need JavaScript enabled to view it.
How to cite this article:
Villar, Á. A., Herrera, E., 2021, Reservoir quality and petrophysical evaluation of the Paleocene paralic sandstones in the Ranchería sub-basin, Colombia: Boletín de la Sociedad Geológica Mexicana, 73 (1), A151220.http://dx.doi.org/10.18268/BSGM2021v73n1a151220
ABSTRACT
The Ranchería sub-basin is an unexplored basin which gives a valuable opportunity to find new perspectives about the hydrocarbon potential in Colombia. The sandy facies of the Paleocene Cerrejón Formation accomplish with the characteristics within the petroleum system, to be considered as a potential reservoir rock. This work aims to evaluate the reservoir quality of the Cerrejón Formation using three cored wells, through the integration of well logs, core sedimentological descriptions, porosity and permeability lab data, and thin-sections analysis. Using GR log patterns and sedimentary cycles, four facies associations (A,B,C,D) were defined associated to an environment of a deltaic plain complex. The well correlation was performed using the sedimentary cycles methodology. Five petrophysical rock-types (mudstone (M), coal (P), sandy mudstone (sM), muddy sandstone (mS), and sandstone (S)) were identified, according to textural and lithological features from the core descriptions, adjusted with well logs analysis and NTG ratio. A supervised neural network model of electrofacies was generated with the GR, RHOB, NPHI, and DT logs combination, using as training curves the wells B and C. The blind test validation was executed in the well C with an 82% of correlation. Petrophysical evaluation was performed calculating shale volume, effective porosity, permeability and water saturation. Reservoir rock properties are fair to moderate with porosities between 0.3-22.9 %, and permeability values that range from 0.02mD to 47mD. The interest intervals average water saturations vary between 0.3 and 0.5. Four hydraulic flow units were estimated with the Winland’s R35 method for the assessment of reservoir quality. There is not a clear relationship between F.A. and HFUs for the Cerrejón Formation, however, the F.A. B comprises the HFUs with the best petrophysical properties. The reservoir quality of Cerrejón Formation is controlled mainly for diagenetic and compositional processes than related to primary deposition. The diagenetic controls in reservoir properties are the calcite cementation, quartz overgrowth, pseudomatrix presence, and feldspar and calcite dissolution. This integrated study provides a good approximation to the understanding of the Cerrejón Formation and the evidence of a moderate reservoir quality.
Keywords: Ranchería sub-basin, electrofacies, petrophysical evaluation, well logs, reservoir quality, Cerrejón Formation.
RESUMEN
La subcuenca de Ranchería es una cuenca inexplorada que brinda una valiosa oportunidad para buscar nuevas perspectivas sobre el potencial de acumulación de hidrocarburos en Colombia. Las facies arenosas de la Formación Cerrejón del Paleoceno cumplen con las características dentro del sistema petrolífero para ser consideradas como potenciales rocas reservorio. Este trabajo tiene como objetivo evaluar la calidad como roca reservorio de la Formación Cerrejón utilizando tres pozos perforados, mediante la integración de registros de pozos, descripciones sedimentológicas de núcleos, datos de laboratorio de porosidad y permeabilidad y análisis de secciones delgadas. Utilizando patrones de registros GR y ciclos sedimentarios se definieron cuatro asociaciones de facies (A, B, C, D) asociadas a un ambiente de planicie deltaica. La correlación de pozos se realizó utilizando la metodología de ciclos sedimentarios. Se identificaron cinco tipos de rocas petrofísicas (lodolita (M), carbón (P), lodolita arenosa (sM), arenisca lodosa (mS) y arenisca (S)), de acuerdo con las características texturales y litológicas de los núcleos, ajustadas con análisis de registros de pozos y relación NTG. Se generó un modelo de redes neuronales supervisada de electrofacies con la combinación de registros GR, RHOB, NPHI y DT, utilizando como curvas de entrenamiento los pozos B y C. La validación del modelo se ejecutó en el pozo C con un 82% de correlación. Se realizó una evaluación petrofísica calculando volumen de arcilla, porosidad efectiva, permeabilidad y saturación de agua. Las propiedades de la roca reservorio son de regulares a moderadas con porosidades entre 0.3-22.9% y valores de permeabilidad que oscilan entre 0.02mD y 47mD. Las saturaciones de agua promedio de los intervalos de interés varían entre 0.3 y 0.5. Se estimaron cuatro unidades hidráulicas de flujo a partir de la porosidad y permeabilidad del núcleo con el método R35 de Winland donde se evalúa la calidad del reservorio. No existe una relación clara entre las asociaciones de facies y las unidades hidraúlicas de flujo para la Formación Cerrejón, sin embargo, el F.A. B comprende las HFU con las mejores propiedades petrofísicas. La calidad como roca reservorio de la Formación Cerrejón es controlada más por procesos composicionales y diagenéticos que los relacionados al ambiente de depósito, ya que no existe una relación clara entre el ambiente deposicional y las unidades hidráulicas de flujo. Los controles diagenéticos en las propiedades del reservorio son la cementación de calcita, el sobrecrecimiento de cuarzo, la presencia de pseudomatriz y la disolución de feldespato y cemento calcáreo. Este estudio integrado proporciona una buena aproximación al entendimiento de la Formación Cerrejón y evidencian una calidad de reservorio moderada.
Palabras clave: Subcuenca Ranchería, electrofacies, evaluación petrofísica, registros eléctricos, calidad de roca reservorio, Formación Cerrejón.
- Introduction
Well logs are used to correlate zones of interest with hydrocarbon accumulation, to identify hydrocarbon reserves and productive zones, to determine fluids content and reservoir thicknesses; and to estimate porosity, permeability, net to gross, geomechanics, mineralogy, lithology, cyclicity, and geological features; well logs are usually applied for oil and gas industry (Asquith and Krygowski, 2004; Rider and Kennedy, 2011; Richardson, 2013). Petrophysical model generation requires rock-fluid properties knowledge, like porosity and permeability, added to well logs interpretation, which are essential for understanding the storage and transmission of fluids in the reservoir (Basan et al. 1997; Gunter et al., 1997a; Ellis and Singer, 2007; Wu and Grana, 2017).Reservoir quality, which is controlled by depositional facies and diagenetic processes, is one of the key controls on prospectivity during petroleum exploration (Gier et al., 2008; Mansurberg et al., 2008). In this war, it should be supplemented with a correct petrophysical characterization and a key petrophysical parameters calculation such as the shale volume, total and effective porosities, permeability, and water saturation (Islam, 2010). On the other hand, a reservoir quality evaluation must be linked with petrographic and sedimentological information, that helps to support the petrophysical findings thus knowing what controls reservoir quality. Finally, this contributes to assist with the appraisal of the economic viability of petroleum discoveries in a frontier basin.
The exploratory character of the Ranchería sub-basin, genetically related with the Maracaibo basin in Venezuela in the Paleocene (Bayona et al., 2011; Mesa and Rengifo, 2011), gives a valuable opportunity to find new perspectives about the hydrocarbon potential of this sub-basin. This work aims to evaluate the reservoir quality, using a multi-technique analysis including petrophysical characterization, hydraulic flow units definition, an electrofacies model, and a diagenetic processes petrographic identification evidenced in the Cerrejón Formation sandstones in the Ranchería sub-basin. This study would be the first petrophysical properties calculation in the Ranchería sub-basin (García et al., 2008; Sánchez and Mann, 2015; Cruz-Ceballos et al., 2020), and it provides a better understanding of the hydrocarbon accumulation potential of the Cerrejón Formation, while affording an important input for subsequent geological modeling of these reservoir facies in future explorations.
- Geological setting
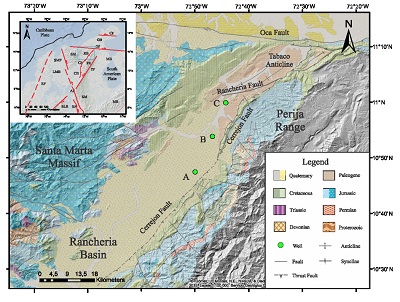
The Ranchería sub-basin is a hinterland basin in the northwestern part of Colombia. It is limited to the north by the right-lateral Oca fault and the Guajira basin, to the south by the Verdesia high which separates the Ranchería Sub-basin from the Cesar sub-basin (Ayala et al., 2009; Bayona et al., 2011; Sánchez and Mann, 2015) (Figure 1). The eastern limit of the basin is the Perija Range, where sedimentary, igneous, and metamorphic rocks from Paleozoic, Jurassic, and Cretaceous are outcropping (Maze, 1984; Bayona et al., 2007). The western limit of the basin is the Santa Marta Massif, composed by Proterozoic and Paleozoic metamorphic rocks, and Mesozoic and Paleogene plutonic and volcanic rocks (Tschanz et al., 1974; Cordani et al., 2005; Cardona et al., 2011; Quandt et al., 2018). Structurally, the basin is defined by a monocline that dips gently to the southeast maintaining a structural continuity with the Santa Marta Massif to the northwest, yet limited to the southeast with the Cerrejón thrust fault (Montes et al.,2010; Sánchez and Mann, 2015). Figure 1 shows the location of the three wells studied in the central part of the Ranchería sub-basin, aligned in an N-S transect following the regional structure strike.
 |
|
Figure 1. Regional map of the Ranchería sub-basin showing the location of the three wells. Color code based on Servicio Geológico Colombiano (2015). RB = Ranchería sub-basin. CB = Cesar sub-basin. MB = Maracaibo basin. LMB = Lower Magdalena basin. GB = Guajira basin. CF = Cerrejón Fault. SMF = Santa Marta Fault. AF = Algarrobo Fault. BF = Bucaramanga Fault. TF = El Tigre Fault. CF = Cuisa Fault. RF = Romeral Fault. OF = Oca Fault. SM = Santa Marta Massif. PR = Perija Range. MR = Merida Range. SM = Santander Massif. SLR = San Lucas Range. |
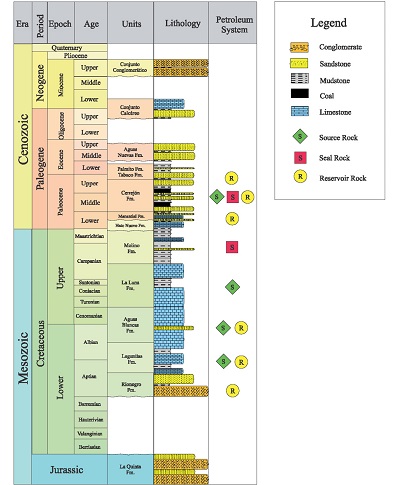
The sedimentary sequence of the Ranchería sub-basin starts from bottom to top with reddish continental sandstones and conglomerates of the Jurassic La Quinta Formation (Maze, 1984), which are in disconformity with the marine sandstones of the Lower Cretaceous Rio Negro Formation (Mesa and Rengifo, 2011) (Figure 2). Since Aptian until Maastrichtian, it was recorded marine units associated with a subsiding basin or a passive margin such as the fossiliferous limestones and calcareous mudstones of Lagunitas Formation and Aguas Blancas Formation, chert-rich and phosphate calcareous mudstone of the La Luna Formation, and shales from the Molino Formation (Cáceres et al., 1980; Bayona et al., 2011; Mesa and Rengifo, 2011) (Figure 2). In unconformity with Molino Formation are the shallow marine fossiliferous limestones and sandstones from Lower Paleocene Hato Nuevo and Manantial Formations (Mesa and Rengifo, 2011) (Figure 2).
The sedimentation during Upper Paleocene records mudstones and sandstones with high coal contents from transitional environments from the Cerrejón Formation (Bayona et al., 2011; Mesa and Rengifo, 2011). Overlaying this unit, there are the sandstones from the Upper Paleocene - Lower Eocene Tabaco Formation and the shales from the Lower Eocene Palmito Formation (Bayona et al., 2011; Mesa and Rengifo, 2011) (Figure 2). In unconformity with the Eocene formations, it is reported the presence of reddish fluvial conglomeratic sandstones and shales from the Middle to Upper Eocene Aguas Nuevas Formation (Mesa and Rengifo, 2011) (Figure 2). Overlaying this unit, in disconformity, it is recorded a calcareous level informally named as Conjunto calcáreo de la Guajira possibly from the Oligocene (Mesa and Rengifo, 2011). At the top of the sequence, it is reported an informal unit called Conjunto Conglomerático that can be correlated with the Middle Miocene-Pliocene Cuesta Formation from the Cesar Sub-basin (Mesa and Rengifo, 2011)(Figure 2).
 |
|
Figure 2. Stratigraphic sequence and petroleum system elements of Ranchería sub-basin. The Paleocene Cerrejón Formation is the reservoir target unit. Modified from Mesa and Rengifo (2011). |
The effective petroleum system in the Ranchería Sub-basin was defined by some authors (García et al., 2008; Mesa and Rengifo, 2011; Sánchez and Mann, 2015; Cruz-Ceballos et al., 2020), sharing an interesting correspondence with the most important oil-producing basins in Colombia and Venezuela, which are Maracaibo Basin and Middle Magdalena Basin (Mesa and Rengifo, 2011).
The oil source rocks are the Cretaceous Cogollo Group and La Luna Formation (García et al., 2008; Cruz-Ceballos et al., 2020). The coal bed methane source rock would be the Paleocene Cerrejón Formation (García et al., 2008). The oil migration and hydrocarbon trapping could occur during transpressive episodes since Eocene-Oligocene, associated with fault systems (Sánchez and Mann, 2015). The best reservoirs are the fractured limestones of Hato Nuevo and Manantial formations, even though, the sandstone reservoir rocks correspond to thin layers in Cerrejón Formation (García et al., 2008). The seal rock in the system is the shaly Molino Formation and intraformational coal layers in the Cerrejón Formation (García et al., 2008). The stratigraphic traps are related to unconformities in the stratigraphic record and are the main exploration target (Mesa and Rengifo, 2011).
All these elements compose the petroleum system of Ranchería sub-basin and provide ground to assume the possibility of a high potential to accumulate hydrocarbons despite the scarce of studies realized in this unexplored basin (García et al., 2008; Sánchez and Mann, 2015; Cruz-Ceballos et al., 2020) (Figure 2).
- Materials and methods
This project was framed in the Universidad Industrial de Santander (UIS) and Agencia Nacional de Hidrocarburos (ANH) agreement which provided the information of three slim-hole wells drilled in the Cesar-Ranchería basin. The information used to develop the project included well logs like gamma-ray (GR), spontaneous potential (SP), neutron porosity (NPHI), density (RHOB), deep resistivity (RT), photoelectric factor (PEF) and sonic compressional (DT) logs, 345 porosity and air permeability core laboratory data, and 774 m of sedimentological core descriptions from Cerrejón Formation (153 m of Well A, 518 m of Well B, and 103 m of Well C).Well logs were provided with borehole diameter and mud filtrate environmental corrections. The RHOB, BPHI and SP curves were edited in erratic measurements. SP log curves in the three wells were normalized and adjusted using the well B reference curve which had a coherent lithologic behavior with the GR log curve. The baseline shift is applied to the SP curve with a shale baseline set to 0 mV. Porosity and air permeability properties were calculated in a CMS-300 core measurement system, integrated, automated permeameter and porosimeter from Core Laboratories.
The interpretation of GR logs patterns and the analysis of sedimentary cycles provide information about the deposition environments of the sedimentary successions (Ramón and Cross, 1997; Habib and Islam, 2014). The sedimentary cycle methodology assumes that the sediment accumulation occurs during stratigraphic base-level cycles of unidirectionally increasing A/S conditions, followed by unidirectionally decreasing A/S conditions (Ramón and Cross, 1997). These trends of increasing and decreasing A/S conditions are concomitant with fining-upward and coarsening-upward gradient movements of laterally linked environments (Ramón and Cross, 1997). On the other hand, the GR patterns allow the identification of major and minor sedimentation cycles and are indicative of different sedimentary facies (Khanam et al., 2017); likewise, they could be interpreted as a trend of grain size, where higher GR values indicate an increase in the clay content (Mondal et al., 2009; Khanam et al., 2017).
For the rock-types classification, well logs information was linked with the sedimentological core descriptions of the Cerrejón Formation for the studied wells, considering lithology, net to gross (NTG) ratio, porosity and permeability data, and other properties recognizable in logs (Krueger, 1968). The rock-types were defined using a cluster analysis through a scatter plot matrix in function of GR, RHOB, NPHI, and DT logs, with the sedimentological core descriptions as a discrete log. SP, RT and PEF logs did not have an adequate discretization of the rock types and they were not used. A supervised learning neural network (The Kohonen algorithm) using a linear quantitative classification method was employed to develop the electrofacies model, because of the previous cluster definition based on the sedimentological core descriptions as an index for the classification. The rock-type curve from the wells B and C acted as a training curve. Once a model linking well logs and electrofacies learned, it was applied to the well A in a blind test to prove their efficiency.
For the petrophysical evaluation, the combination of GR and SP logs was used to calculate the merged shale volume (Vsh) using the minimum method (Equation 1 and 2) (Tiab and Donaldson, 2015). GRlog is the GR log value, SPlog is the SP value, GRmin and GRmax are the minimum and maximum GR values respectively, as well SPmin and SPmax using SP values, in both cases obtained through a histogram of the two properties.
 |
 |
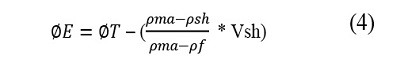
The total porosity (ϕT) was calculated using the RHOB log method (Equation 3) (Tiab and Donaldson, 2015), where ρma is the matrix density log (sandstone density, 2.65 g/cm3), ρlog is the RHOB log value, and ρf is the fluid density (fresh water, 1 g/cm3). The effective porosity (ϕE) excludes all the bound water related to clays but involves all the connected pores that contribute to flow (Tiab and Donaldson, 2015). It was determined from the RHOB log derived from ϕT, where ρsh is the shale density (2,5 g/cm3) (Equation 4).
 |
 |
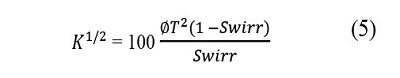
The permeability (K) model was calculated using Coates equation (Equation 5), based on laboratory-measured data and looking for a relationship with the total porosity (ϕT). With the lack of special core analysis, a porosity-related permeability method was employed, in this case, Coates curve fitted better with core permeability data than Timur or Wyllie Rose methods. In this equation, Swirr is the irreducible water saturation, calculated using the Buckles number from log analysis (Crain, 2006). Buckles number is the product between ∅E and Sw in clean pay zones.
 |
The water formation resistivity (Rw) is obtained from the equivalent water resistivity (Rwe), using the SP-2 log interpretation chart from Schlumberger (2000). The Rwe was calculated through the equation 6, from the maximum SP value in a clean aquifer zone (Schlumberger, 2000; Crain, 2006). ESSP corresponds to static spontaneous potential, k is a constant dependent of temperature and water formation salinity, and Rmfe is the equivalent mud filtrate resistivity determined by SP-1 log interpretation chart (Schlumberger, 2000).
 |
The water saturation (Sw) was calculated depending on the shale volume values. Archie´s equation (Archie, 1942) was used with Vsh values less than 0.05 (Equation 7), this is useful in clean sandstones, where a is the tortuosity factor, m is the cementation exponent, and n is the saturation exponent. Due to the lack of laboratory measurements, theoretical values were considered for the parameters a=1, n=2, and m=2 (Tiab and Donaldson, 2015).
 |
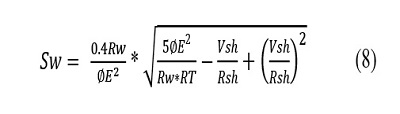
On the other hand, Simandoux equation (Simandoux, 1963) is used with Vsh values higher than 0.05 (Equation 8), where Rsh is the resistivity in the shale zone (5 ohm-m). In muddy rocks, the Archie equation overestimates the water saturation, so the Simandoux model considers the shale volume in the matrix providing a more confident water saturation estimation.
 |
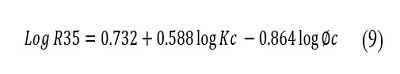
Hydraulic flow units (HFU) were calculated by the Winland R35 method (Windland, 1972; Gunter et al., 2014) (Equation 9), because of it was found that using R35 values provides excellent results in to correlate porosity and permeability data (Ampomah et al., 2016; Ross-Coss et al., 2016). On the other hand, HFU modelling with air permeability data is recommended do it with Winland’s method than other concepts like a RQI vs FZI approach, in which it is preferable to employ Klinkenberg corrected permeability data. The R35 factor refers to the radius of the poral throat in which the poral networks are interconnected and form a pattern of continuous flow, when the core samples are 35% saturated during the mercury porosimeter test (Hartmann and Coalson, 1990). R35 value is calculated using the Equation 9, where Kc is the average air permeability, and ϕc is the core measured porosity.
 |
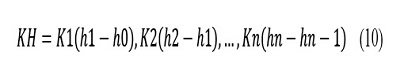
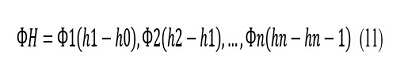
A stratigraphic modified Lorenz plot (SMLP) was built using cumulative flow capacity (KH%) and cumulative storage capacity (ФH%), to validate the HFU calculated. The flow capacity (KH) and storage capacity (ФH) are functions of core porosity and permeability values with a reservoir interval thickness (sampling depths) (Momta et al., 2015). The KH, ФH, KH%, and ФH% values were determined through Equation 10, 11, 12, and 13 (Gunter et al., 1997b), where K is permeability, h is sample depth, and Ф is fractional porosity.
 |
 |
 |
 |
Mineral composition and porosity were determined for 60 samples by standard point-count (300 points) analysis using blue epoxy resin impregnation. Grain sizes were measured using the sieving technique as well as the sorting technique. Variables such as total porosity, mean grain size, and cementing contents were measured to estimate the reservoir quality.
- Results
4.1. STRATIGRAPHIC CYCLES AND SEDIMENTARY ENVIRONMENTS
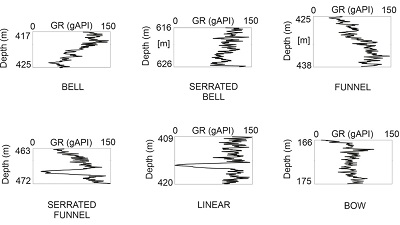
The interpretation of GR logs patterns is linked to the deposition environments of the sedimentary successions (Habib and Islam, 2014; Khanam et al., 2017). Four different log patterns are identified for the Cerrejón Formation in the wells studied: funnel, bell, bow, and linear shape (Figure 3). The names and interpretations were based and modified from Habib and Islam (2014) and Khanam et al. (2017). The funnel pattern indicates a coarsening-upward sequence related to an increase in the hydrodynamic conditions towards the top at the time of deposit.(Figure 3) (Khanam et al., 2017).
 |
|
Figure 3. GR logs patterns (bell, serrated bell, funnel, serrated funnel, linear, and bow) present in the Cerrejón Formation in the Well B. |
The bell pattern reflects a fining-upward sequence and indicates a decreasing in the hydrodynamic regime towards the top (Figure 3) (Khanam et al., 2017). Serrated funnel or bell patterns are interpreted as an indicator of heterogeneity or cyclicity in the deposition (Figure 3). The linear pattern denotes a uniform depositional fine-grained sequence (Figure 3) (Khanam et al., 2017). The bow-shaped curve indicates small cycles of fining-upward and coarsening-upward sequences. It is interpreted as subtle changes in progradational successions (Figure 3) (Khanam et al., 2017).
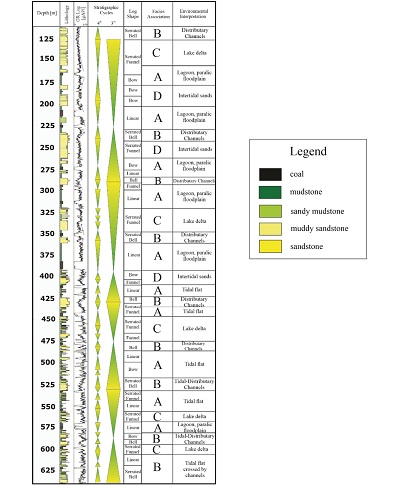
Based on the definition of third and fourth-order stratigraphic cycles that reflect the changes of base-level (Ramón and Cross, 1997; Catuneanu, 2019) (Figure 4), linked to the analysis of GR log shapes, four facies associations (F.A.) were defined for the Cerrejón Formation (Figure 4):
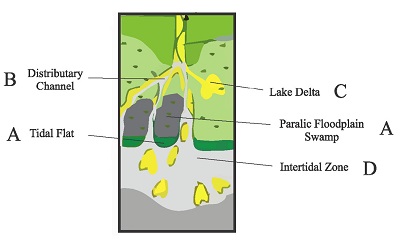
F.A. A: This F.A includes aggradational sequences expressed for linear and bow log shapes. A balance between fining-upward and coarsening-upward cycles is typical for this association. (Figure 4). Thick sequences of coal, mudstones, and some funnel-shaped muddy-sandstones beds were interpreted as lagoons, swamps or paralic floodplains of a deltaic plain. Tidal flats product of the sheet flow effect during the main flood stages, are also interpreted (Figure 5) (Bayona et al., 2011; Wróblewska and Kozlowska, 2019).
F.A. B: This F.A. corresponds to fining upward sequences expressed for bell shapes. Fining-upward sandstones with some levels of shales are characteristic of this association (Figure 4). Retrogradational tidal and interdistributary sandy channels formed during the main flood phases were interpreted for this F.A (Figure 4) (Nichols, 2009; Wróblewska and Kozlowska, 2019).
F.A. C: This F.A. consists of coarsening upward sequences expressed principally in funnel patterns with aggradational levels. Coarsening-upward successions of mudstones and sandstones correspond to this F.A. (Figure 4). The sedimentary environment is interpreted as lake delta deposits in a deltaic plain system (Figure 5) (Dabrio and Arche, 2010; Bayona et al., 2011; Waksmundzka, 2013).
F.A. D: This F.A. includes aggradational sequences characterized by bow, linear, and funnel shapes. Small and cyclic grain size variations slightly coarsening-upward are typical of this association (Figure 4). The dominance of sandstones levels differentiates this facies association from F.A. A, which involves mostly fine-grained facies. The sedimentary environment is interpreted as intertidal sands, interpreted locally as flow delta sands when coarsening-upward sandstones are abundant (Figure 5) (Morón et al., 2007; Dabrio and Arche, 2010).
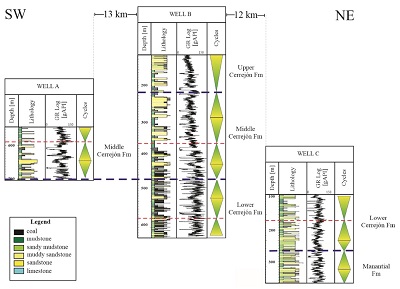
The well correlation is carried out by considering changes in stratigraphic cycles and core sedimentological descriptions (Ramon and Cross, 1997). The Cerrejón Formation appears in the three wells worked but not complete (Figure 6).In this way, The Cerrejón Formation was subdivided in three intervals: Lower Cerrejón, present in the wells C and B; Middle Cerrejón, in the wells A and B, and lower members of Upper Cerrejón, evidenced merely in the well B (Figure 6).
 |
|
Figure 4. Relationship between core description, GR pattern, stratigraphic cycles, facies association, and depositional environments for the Cerrejón Formation in the well B. |
 |
|
Figure 5. Schematic deltaic plain complex for the Cerrejón Formation. |
 |
|
Figure 6. Correlation panel between the three different wells using third order stratigraphic cycles. The dark blue lines indicate a formational contact (Manantial and Cerrejón Fm) or an intraformational (between members) contact (Upper, Middle and Lower Cerrejón). The red lines are intraformational tops to adjust the correlation between the three wells through the stratigraphic cycles methodology. The exhibited intervals represent the cored thickness in each well, where the upper missing segment corresponds to recent alluvial deposits. |
4.2. ELECTROFACIES ANALYSIS
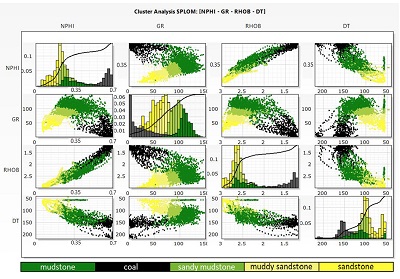
The electrofacies model was generated considering a cluster analysis through a scatter plot matrix including RHOB, NPHI, GR, DT logs, and the sedimentological core descriptions from the Cerrejón Formation (Figure 7).
Textural classification and lithology were the main criteria to define the rock-types. Five rock types were defined for the Cerrejón Formation: (1) mudstone, (2) coal, (3) sandy mudstone, (4) muddy sandstone, and (5) sandstone (Figure 7). The facies code corresponds to Farrell et al. (2012). The net to gross ratio adjusted the clean sandstones intervals. GR.
- Mudstone (M): This petrophysical rock-type is characterized by an average NPHI (0.4 v/v), high GR (105 gAPI), average RHOB (2.55 g/cm3), and high DT log (105 μsec/ft) values (Figure 7). The highest GR values differentiate this rock-type from the others facies (Figure 7).
- Coal (P): For the narrow range of petrophysical properties, this rock-type defines a distinct cluster easily differentiated from other electrofacies using GR,RHOB, and NPHI values (Figure 7). It is characterized by a high NPHI (0.5 v/v), very low GR (28 gAPI), low RHOB (2.05 g/cm3), and high DT log (155 μsec/ft) values (Figure 7).
- Sandy mudstone (sM): Despite the wide range of petrophysical properties, this petrophysical rock-type allows their identification using NPHI and GR logs to differentiate from muddy sandstone rock-type (Figure 7). It is characterized by an average NPHI (0.35 v/v), average GR (88 gAPI), average RHOB (2.62 g/cm3), and average DT log (105 μsec/ft) values (Figure 7). This rock-type shares similarity with shale rock-type but it has less GR and DT log vales.
- Muddy sandstone (mS): This petrophysical rock-type could be separated from the sandy mudstone rock-type for having lower values of GR and RHOB logs (Figure 7). It is characterized by an average NPHI (0.37 v/v), low GR (72 gAPI), low RHOB (2.5 g/cm3) and average DT log (95 μsec/ft) values (Figure 7). NTG ratio corresponds to 0.13.
- Sandstone (S): This petrophysical rock-type corresponds to clean sandstones, provide them differentiating for the muddy sandstones rock-type, using GR, DT, and NPHI values. It is characterized by a low NPHI (0.27 v/v), low GR (51 gAPI), average RHOB (2.65 g/cm3) and low DT log (80 μsec/ft) values (Figure 7). The NTG ratio calculated is 0.58.
 |
|
Figure 7. Cluster analysis showing the distribution of the five rock types, using a scatter plot matrix (SPLOM) between NPHI, GR, RHOB and DT logs. Notice the GR log is the main factor to differentiate the five rock types. NPHI, RHOB and DT logs provide a better discretization in coal and sandstone rock types, where low GR values are overlapped. |
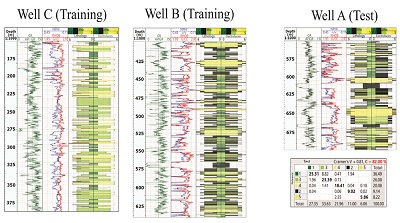
A supervised neural network with a linear quantitative classification method was used to develop the electrofacies model. Based on the cluster analysis (Figure 7), GR log showed a better discretization of the rock-types whence was the parameter with more weight to assign priorities for the learning model. Likewise, NPHI and RHOB logs has a lower weight than GR, and the DT log has the lowest weight. As training curves were employed the wells B and C rock-type curve based on sedimentological description yet adjusted with well logs and the core petrophysical data. Once the model had learned, it was applied to the southern well C evidencing a correlation of 82%, using the Cramer’s V coefficient, with the rock-types curve (Figure 8).
 |
|
Figure 8. Composite log illustrating the electrofacies model test in the well C with an 82% of correlation. Log curves including the GR, RHOB and NPHI logs (Track 2 and 3). The training curves for the model corresponded to core sedimentological descriptions (Track 4) for the wells B and C. The track 5 refers to the electrofacies model generated through the supervised method. The lithology color legend is found in the Figure 4. |
4.3. PETROPHYSICAL CHARACTERIZATION
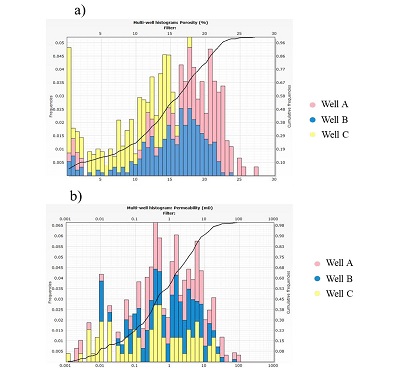
The petrophysical characterization involves the integration of laboratory data, well logs, and core sedimentological information, which are an input to the reservoir quality evaluation in static conditions. The well log data was evaluated using conventional well log analysis. The reservoir quality in the Cerrejón Formation sandstones was evaluated calculating shale volume, porosity, permeability, and water saturation in the three wells studied. The shale volume was calculated using the minimum method of GR and SP logs linear combination (Figure 10). GR log was used because of the influence in the rock-types discretization specially between mudstones and sandstones, likewise, SP log showed an adequate clean and muddy sandstones differentiation. The shale volume in mudstones ranges between 0.6 and 0.9. The sandstones values are less than 0.4 in muddy sandstones, and less than 0.2 in clean sandstones (Figure 10). The core porosity values ranges from 0.3% to 22.9% for the Cerrejón Formation in the three wells (Figure 9). An average porosity value of 14.7% was recorded on the histogram plot with a standard deviation value of 6% (Figure 9). The low porosity values (0.3-2%) were observed primarily in the well C, which corresponds to the base of the Cerrejón Formation (Figure 6), and are related to mudstones and sandy mudstones. The higher porosity values (15-22.9%) were evidenced in wells A and B, which comprises to the middle and top of the Cerrejón Formation (Figure 6), and are linked to muddy sandstones and sandstones. The effective porosity model was defined using the RHOB log method, which fits in a consistent way with the core porosity, with a relative error of 0.13 on average for the three wells (Figure 10). The discrepancies between the core data and the log-derived curve may be as a result of different measurements scales or lithological factors.
 |
|
Figure 9. a) Core porosity histogram showing a distribution in a range between 0.3-22.9% in the three wells. b) Core permeability histogram evidencing an irregular grouping in an interval between 0.02 to 47 mD in the three wells. |
The air permeability values ranges from 0.02mD to 47mD for the Cerrejón Formation in the three wells (Figure 9). An average permeability value of 0.69mD was recorded on the histogram plot with a standard deviation value of 7.8% (Figure 9). The very low permeability values (0.02-0.1mD) were observed commonly in the well C, and are associated to muddy fine-grained sandstones, probably because of carbonate cement occluding flow pathways or diagenetic processes related. Fair to moderate permeability values (1-47mD%) were evidenced mainly in wells A and B, attributed to muddy sandstones and sandstones reservoir quality targets. The permeability model was calculated through the porosity-based Coates method, which was the best approximation with the laboratory data, with a relative error of 1.79 (Figure 10). The dissimilarities may be explicated because of very low permeabilities rocks which are affected by increasing-porosity diagenetic processes like feldspar or carbonate dissolution.
The Rw value was obtained using the SP-2 interpretation chart (Schlumberger, 2000), based on the Rwe calculation. An average water resistivity of 0.68 was estimated for the Cerrejón Formation in the three wells. The water saturation model was estimated depending on the Vsh values, where the Archie’s equation was employed with Vsh values <0.05, and the Simandoux equation was used in higher Vsh values, considering a shaly/sand reservoir (Figure 10). The interest intervals definition was defined through the net pay calculation, using Vsh, ϕ, and Sw cutoffs in the reservoir properties. The cutoff values corresponds to: Vshmax=0.4, ϕmin=0.1, and Swmax=0.5. The water saturation in the Cerrejón Formation interest intervals ranges between 0.3 to 0.5 (Figure 10). The lowest Sw values (>0.2) corresponds to coal layers which have a high resistivity values not considered as interest intervals (Figure 10).
 |
|
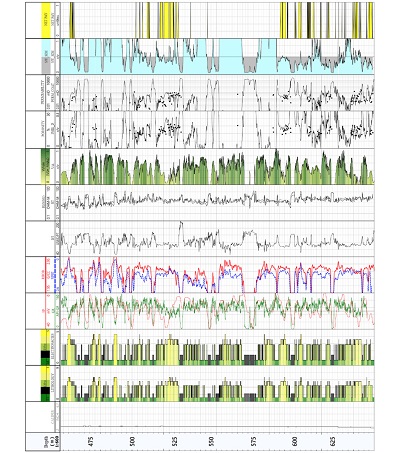
Figure 10. An integrated template showing the relation between core descriptions (Track 2) and electrofacies model (Track 3) from a section (465-645m) of Cerrejón Formation in well B. The lithology color legend is found in the Figure 4. It also includes the petrophysical characterization evidencing Caliper (Track 1), GR (Track 3), SP (Track 3), RHOB (Track 4), NPHI (Track 4), DT (Track 5) and Rt (Track 6) logs, shale volume obtained with GR and SP logs (Track 7), effective porosity curve calculated with density log with the lab data (Track 8), permeability curve with the core samples (Track 9),water saturation curve with a 0.5 gray-colored cutoff (Track 10), and net pay flag intervals (Track 11). |
4.4. HYDRAULIC FLOW UNITS (HFUS)
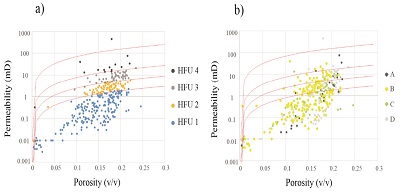
The HFU concept is different than lithofacies as it aims to cluster similar fluid pathways in the reservoir rather than based on the distribution of geological and physical parameters at pore scale (Ebanks et al., 1992; Lee et al., 2002; Perez et al., 2005). The HFU identification and classification were based on the Winland’s R35 methodology (Gunter et al., 2014; Ross-Coss et al., 2016), where R35 is related to the pore throat size. Using a log-linear relationship of Permeability (mD) vs Porosity (v/v), filtering them by the value of R35, four flow units were identified for the Cerrejón Formation whose factor of R squared was greater than 0.65 (Figure 11a). The flow units are ordered depending on their reservoir quality properties, being HFU 4 the rocks with the best porosity/permeability attributes and HFU 1 with the worst.
 |
|
Figure 11. a) Core permeability vs core porosity crossplot showing the hydraulic flow units determination by the Winland’s method for the three wells. b) Core permeability vs core porosity crossplot showing four facies associations defined for the three cored wells. |
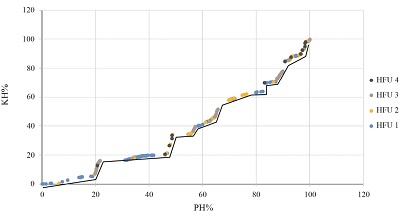
A stratigraphic modified Lorenz plot (SMLP) illustrates the cumulative flow capacity (%Kh) versus the cumulative storage capacity (ФH%) ordered in the stratigraphic sequence of the reservoir (Figure 12). The inflection points or slope changes in the SMLP, indicate variations in flow or storage capacity, allowing for the reservoir flow evaluation (Mahjour et al., 2016). Steeper slopes indicate faster flow rates and sub horizontal trends which suggest little flow (Mahjour et al., 2016). Thus, the SMLP validates the HFUs definition showing a correlation between high slopes with HFU 4 and 3 (Figure 12), and flat trends with HFU 1 and 2 (Figure 12).
 |
|
Figure 12. Stratigraphic modified Lorenz plot (SMLP) for the well B, evidencing the Winland’s flow units interpretation with straight lines segments on the graphic. Notice that higher slopes correspond to upper HFUs. |
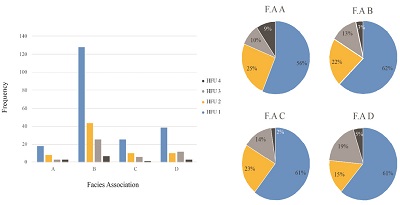
The porosity and permeability relationship with facies associations comprehend an understanding of mechanical processes during transportation, deposition, and diagenesis, likewise, it provides the accuracy of evaluating reservoir parameters inside of a depositional model (Figure 11b). Analyzing if the depositional settings associated with F.A. influence the reservoir quality properties, a composed bar chart with its complementary pie charts examine the hydraulic flow units occurrence in each F.A (Figure 13). The interdistributary channels (F.A B) have the highest population of core samples showing a prevalence of HFU 1 (62%), but the presence of HFU 3 and HFU 4 in a 16% indicates that most of the rocks with the best reservoir quality properties in these wells is present in this facies association (Figure 13). On the other hand, it should be noted that despite the sandstones between coal layers in a paralic floodplain deposit (F.A A) it as a very low occurrence in core samples, HFU 3 and 4 represent a 19% (Figure 13). This can be interpreted as small channels cutting these floodplains which do not have enough vertical resolution to be considered in the GR patterns analysis. In general terms, there is a similar percentual relationship between the different facies association with the hydraulic flow units no evidencing a link among them, excepting the F.A B which accumulates best thicknesses in the sequence with the HFUs with the best reservoir quality properties (Figure 13).
 |
|
Figure 13. Bar chart and pie charts showing the relationship between facies association and hydraulic flow units in the three cored wells. Color code corresponds to HFU legend in both diagrams. |
4.5. PETROGRAPHIC EVIDENCE
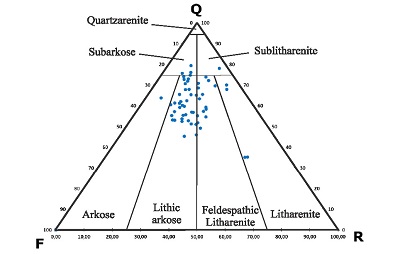
The samples used from the Cerrejón Formation are classified as lithic arkose to feldspathic litharenite (Figure 14). The presence of monocrystalline quartz grains is dominant compared to polycrystalline grains. Feldspars have a similar proportion between alkaline feldspars (orthoclase/microcline) and plagioclase. The low percent of Kfs in the samples explains the lower GR values associated with scarce clay content in sandstones.
 |
|
Figure 14. Folk diagram classification of the Cerrejón Formation sandstones. Q = Quartz. F = Feldspar. R = Rock fragments. |
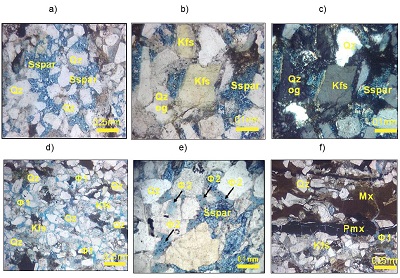
Rock fragments have also been found as an important constituent, where metamorphic rocks fragments have a higher percentage compared with igneous and sedimentary fragments. Ductile grains such as muscovite are present in small proportions. The sandstones of the Cerrejón Formation also carry some clay minerals and spar as pore-filling materials (Figure 15a). Calcite, quartz, and iron oxides were observed as major cementing materials. Quartz cementations mainly occur as syntaxial overgrowths (Figure 15b,c). Siderite, calcite, and iron oxides occur as authigenic grains.
The visual porosity of the studied sandstones observed by thin sections ranges from 2% to 25%, with an average value of 13%, being quite similar with the core lab data and log-porosity curve (Figure 9,10). Both primary (intergranular) (Figure 15d) and secondary (intragranular) porosities (Figure 15e) were observed in the studied samples. Primary porosity is found on average in 4%, and secondary porosity in 9% on average. In this way, increasing-porosity diagenetic factors are enhancing the reservoir quality. The diagenetic processes of calcite cementation and quartz overgrowth are the major factors that reduced porosity and permeability in the studied sandstones, as well as the mechanic compaction process of the ductile grains presenting pseudomatrix (Figure 15f). On the other hand, a solution-related porosity (secondary porosity), created by the dissolution of the feldspar grains and calcite cement, is frequently observed and led to an increase in porosity in sandstones.
 |
|
Figure 15. a) Pore-filling spar cement, b) syntaxial quartz overgrowth decreasing porosity, c) crossed-polarized light showing quartz overgrowth and spar cement filling pores decreasing porosity, d) primary porosity, e) secondary porosity for calcite cement and feldspar grains dissolution, f) clay and organic matter pseudomatrix evidencing mechanical compaction. Qz = Quartz. Kfs = Alkaline feldspar. Sspar = Spar cement. og = overgrowth. Φ1 = Primary porosity. Φ2 = Secondary porosity. Mx = Clay matrix. Pmx = Pseudomatrix. |
- Discussion
The relationships of stratigraphic cycles compared with sequence models presented for the Cerrejón Formation (Morón et al., 2007), and detailed descriptions of its members (Bayona et al., 2011), allow to relate coastal environments, mainly intertidal plains, with fluvial channels in deltaic plains (Figure 5). The sequences described in this work provide detail regarding how the cyclicity in the unit remains unchanged, in genetically related facies in transitional-coastal environments such as lagoons, paralic environments, intertidal deposits, and distributary channels cutting floodplains, for the three wells in the Cerrejón Formation (Figure 4, Figure 6). The environmental interpretation agrees with studies carried out by Morón et al. (2007) and Bayona et al. (2011), in outlying areas from the studied wells, this allows us to suggest a cyclostratigraphic continuity for the Cerrejón Formation throughout the basin.
The electrofacies analysis using supervised neural networks combines sedimentological information with well logs analysis to identify rock types with a geological support, and it can extrapolate it to places where there are no cores. The presented model calibrated with the core information suggests an optimal correlation that permits to introduce a strong input for future works that include analysis of seismic lines to examine the areal distribution of reservoir properties (Figure 8). For the Cerrejón Formation, the inputs presented in this work can be easily extrapolated to other areas of the basin, due to the presence of coals with very evident petrophysical signatures that facilitate their correlation. Other electrofacies models have petrographic support with which they were able to validate the lithological differences between facies in a more efficient way, however, they did not find that same relationship with the electrofacies, having an uncertainty margin with genetically different facies, but with similar physical properties (Prelat et al., 2015). For this reason, to generate models in unexplored basins as a first approach, it is easier to work with simpler models where the differences between the physical properties of the rock prevail over the genetic origin of it.
The relationship between hydraulic flow units with the reservoir quality is common in the literature and provides an optimal porosities and permeabilities grouping methodology (Pérez et al., 2005; Orodu et al., 2016; Ampomah et al., 2016). Associating the HFUs with their environmental response, there is no clear relationship between best petrophysical properties with the facies associations for the Cerrejón Formation in these wells. Nonetheless, the distributary channels (F.A B) encompass a high part of intervals with HFU 3 and HFU 4, which have a high porosity and permeability relationship. This can be explained for the higher sandstone thicknesses of this facies association, the lower clay matrix and muscovite content, the high flow velocity and intense erosion of these distributary channels expressing a higher primary porosity, being a depositional process which controls the hydraulic flow units occurrence in this formation (Liu et al., 2015; Fan et al., 2019). On the other hand, the secondary porosity estimated by petrography indicates that diagenetic factors are conditioning the flow units distribution, in this case decreasing the porosity and permeability evidenced in the high presence of HFU 1 and 2.
The reservoir quality evaluation of Cerrejón Formation in these wells shows a pattern of good petrophysical properties for the HFU3 and HFU4 and clean sandstones and muddy sandstones electrofacies, having average values of porosity of 10-15% and permeability of 1-10 mD (Figure 9). Figure 16 evidences a heterogeneous distribution of HFU for clean and muddy sandstones in a narrow thickness interval, which can be explained for differences in textural parameters such as grain size or sorting, having effects in the porosity and permeability of the reservoir facies. Both calcite cementation and quartz overgrowth play an important role in reducing porosity and permeability in HFU1 (Walderhaug, 1996; Taylor et al., 2015) (Figure 16). Deformation of the ductile grains instigated by the adjacent rigid grains reduced the primary porosity in the process of mechanical compaction, playing a role in reducing the primary porosity and permeability of the sandstones in HFU 2 (Tada and Siever, 1989; Bjorkum. 1994) (Figure 16). The later stage of dissolution of the feldspar grains and calcite cement led to a significant increase in secondary porosity in HFU 4, more than in HFU 3, which has only the influence of primary porosity (Taylor, 1990; Wróblewska and Kozlowska, 2019) (Figure 16). The petrographic evidence confirms the range of values of porosity measured in the laboratory and calculated by well logs, indicating that Cerrejón Formation as first insights presents good properties as a reservoir rock in some intervals, which controlled more for diagenetic and compositional processes. This is consistent with García et al. (2008) and Mesa and Rengifo (2011), where they slightly mention that the Cerrejón Formation has potential as a sandstone reservoir rock in the basin (Figure 10). However, the lateral continuity uncertainties, and the impossibility of defining entrapments due to the lack of seismic lines available, leave an uncertain picture about its areal distribution as a reservoir rock. It should be noticed that facies association genetically related to their sedimentation environment is found in the three wells, supplying an idea about the homogeneity of the reservoir throughout the basin, and allowing for the definition of intervals of interest that could be found in other areas of occurrence of the formation.
 |
|
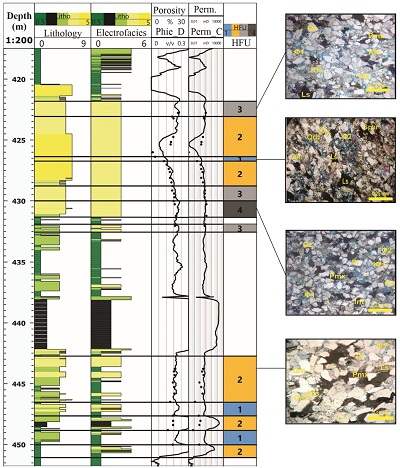
Figure 16. An integrated template showing the relationship between core description (Track 1), electrofacies (Track 2), porosity curve fitting with the lab data (Track 3), permeability curve with the core samples (Track 4), hydraulic flow units (Track 5), and a petrographic evidence of the differences in porosity and permeability values in well B. The lithology color legend is found in the Figure 4, and the HFU legend in the Figure 9. |
- Conclusions
This work focused on evaluating the reservoir quality of the Cerrejón Formation using three cored wells, through the integration of results from well logs, core sedimentological descriptions, porosity and permeability lab data, and petrographic analysis.
Using GR log patterns and third and fourth order sedimentary cycles, four facies associations were defined associated to a deltaic plain complex for the Cerrejón Formation. F.A A corresponds to lagoon and paralic floodplains, F.A. B is interpreted as distributary channels, F.A C as lake delta deposits, and F.A. D was related with intertidal sands.
Supervised neural networks were utilized to generate the electrofacies model, where five petrophysical rock types: mudstone (M), coal (P), sandy mudstone (sM), muddy sandstone (mS), and sandstone (S), were identified in the Cerrejón Formation. The well B and C lithology curves were employed as training curves for the model. The blind test validation in the well C obtained an 82% of correlation.
A petrophysical evaluation of the Cerrejón Formation has been performed. Reservoir rock properties are fair to moderate with porosities that ranges between 0.3-22.9 %, and permeability values between 0.02mD to 47mD. The interest intervals average water saturations vary between 0.3 and 0.5.
Four hydraulic flow units were estimated from core porosity and permeability with the Winland’s R35 method for the assessment of reservoir quality. There is not a clear relationship between F.A and HFUs for the Cerrejón Formation, however, the F.A. B comprises the HFUs with the best petrophysical properties.
The reservoir quality of Cerrejón Formation is controlled mainly for diagenetic and compositional processes than related to primary deposition depositional since there is no clear relationship between depositional environment and hydraulic flow units. The diagenetic controls in the reservoir properties are the calcite cementation, quartz overgrowth, and pseudomatrix presence, which indicate decreasing in porosity and permeability. Felspar grains and calcite cement dissolution generate secondary porosity improving the reservoir rock properties in the sandstones.
This integrated study of environmental interpretation, hydraulic flow units, electrofacies analysis, petrophysical properties calculation and diagenetic process identification, provides a good approximation to the understanding of the Cerrejón Formation and the evidence of a moderate reservoir quality.
Funding
This work has been financially supported by “Certificación de Estratigrafía Física y de la Calidad de los núcleos de perforación recuperados por la ANH en las Cuencas Valle Inferior del Magdalena, Cesar y Ranchería” Project, which is included in FP4842-454-2017 agreement celebrated between COLCIENCIAS, Universidad Industrial de Santander, and Fiduciaria La Previsora S.A, vinculated with Agencia Nacional de Hidrocarburos (ANH) in 730/327 agreement in 2016. The financial support provided the well data including petrography samples, sedimentological descriptions, petrophysical core data, well logs and computing facilities for this research.
Acknowledgements
Special thanks to the Agencia Nacional de Hidrocarburos (ANH) and Departamento Administrativo de Ciencia, Tecnología e Innovación (COLCIENCIAS), for the information required in this article. We appreciate the support given from Vicerrectoría de Investigación y Desarrollo from Universidad Industrial de Santander, and the backing given by professors and master students from Universidad Industrial de Santander contributing to a better development of the ideas of manuscript. We also thanks to the reviewers of the manuscript whose comments and suggestions were fundamental to the culmination of the document.
References
Ampomah, W., Balch, R. S., Ross-Coss, D., Hutton, A., Cather, M., Will, R. A, 2016, An Integrated Approach for Characterizing a Sandstone Reservoir in the Anadarko Basin: Offshore Technology Conference. http://dx.doi.org/10.4043/26952-ms
Archie, G. E., 1942, The Electrical Resistivity Log as an Aid in Determining Some Reservoir Characteristics: Transactions of the AIME, 146(01), 54–62. http://dx.doi.org/10.2118/942054-g
Asquith, G., Krygowski, D., 2004, Basic Relationships of Well Log Interpretation. Basic Well Log Analysis: American Association Petroleum Geology, 16, 140. https://doi.org/10.1306%2Fmth16823c1
Ayala, R. C., Bayona-Chaparro, G. A., Ojeda-Marulanda, C., Cardona, A., Valencia, V., Padrón, C., García, A., 2009, Estratigrafía y procedencia de las unidades comprendidas entre el Campaniano y el Paleógeno en la subcuenca de Cesar–Aportes a la evolución tectónica del área: Geología Colombiana, 34, 3-33.Badillo, J. D., 2011, Potencial Hidrocarburífero de la Cuenca Ranchería, Colombia: Doctoral dissertation, Escuela de Geología, Universidad Industrial de Santander.
Basan, P. B., Lowden, B. D., Whattler, P. R., Attard, J. J., 1997, Pore-size data in petrophysics: a perspective on the measurement of pore geometry: Geological Society, 122(1), 47–67. http://dx.doi.org/10.1144/gsl.sp.1997.122.01.05
Bayona, G., Ochoa, F. L., Cardona, A., Jaramillo, C., Montes, C., Tchegliakova, N., 2007, Procesos orogénicos del Paleoceno para la cuenca de Ranchería (Guajira, Colombia) y áreas adyacentes definidos por análisis de procedencia: Geología Colombiana, 32, 21-46. http://dx.doi.org/10.15446/gc
Bayona, G., Montes, C., Cardona, A., Jaramillo, C., Ojeda, G., Valencia, V., Ayala-Calvo, C, 2011, Intraplate subsidence and basin filling adjacent to an oceanic arc-continent collision: a case from the southern Caribbean-South America plate margin: Basin Research, 23(4), 403–422. https://doi.org/10.1111%2Fj.1365-2117.2010.00495.x
Bjorkum, P.A., 1994, How important is pressure in causing dissolution of quartz in sandstones?: Journal of Sedimentary Research, 66(1), 147-154. http://dx.doi.org/10.1306/a25ff5ad-171b-11d7-8645000102c1865d
Cáceres, H, Camacho, R., Reyes, J, 1980, The Geology of the Ranchería basin: Colombian Association of Petroleum Geologists and Geophysicists, 1-31.
Cardona, A., Valencia, V. A., Bayona, G., Duque, J., Ducea, M., Gehrels, G., Ruiz, J., 2011, Early-subduction-related orogeny in the northern Andes: Turonian to Eocene magmatic and provenance record in the Santa Marta Massif and Ranchería Basin, northern Colombia: Terra Nova, 23(1), 26–34. http://dx.doi.org/10.1111/j.1365-3121.2010.00979.x
Catuneanu, O., 2019, Model-independent sequence stratigraphy: Earth-Science Reviews, 188, 312–388. http://dx.doi.org/10.1016/j.earscirev.2018.09.017
Cordani, U. G., Cardona, A., Jimenez, D. M., Liu, D., Nutman, A. P., 2005, Geochronology of Proterozoic basement inliers in the Colombian Andes: tectonic history of remnants of a fragmented Grenville belt: Geological Society, 246(1), 329–346. http://dx.doi.org/10.1144/gsl.sp.2005.246.01.13
Crain, E. R., 2006, Crain’s Petrophysical Pocket Pal. Ontario: ER Ross.
Cruz-Ceballos, L.F., García-González, M., Cruz-Guevara, L.E., Avendaño-Sánchez, G.M, 2020, Geochemical Characterization and Thermal Maturation of Cerrejón Formation: Implications for the Petroleum System in the Ranchería Sub-Basin, Colombia: Geosciences, 10, 258. http://dx.doi.org/10.3390/geosciences10070258
Dabrio, C.J., Arche, A, 2010, Playas, in: Arche A., (ed.), Sedimentología: del proceso físico a la cuenca sedimentaria: Madrid, Consejo Superior de Investigaciones Científicas, 1287.
Ebanks, W., Scheihing, M., Atkinson, C., 1992, Flow Units for Reservoir Characterization: in D. Morton-Thompson, A.M. Woods (Eds.): Development Geology Reference Manual, American Association of Petroleum Geologists Methods in Exploration Series 10, 282-284 p.
Ellis, D.V., Singer, J,M., 2007, Well logging for earth scientists: Dordretcht, Springer. 10.1007/978-1-4020-4602-5
Farrell, K. M., Harris, W. B., Mallinson, D. J., Culver, S. J., Riggs, S. R., Pierson, J., Lautier, J. C., 2012, Standardizing texture and facies codes for a process-based classification of clastic sediment and rock: Journal of Sedimentary Research, 82(6), 364-378. https://doi.org/10.2110/jsr.2012.30
Fan, A., Yang, R., Lenhardt, N., Wang, M., Han, Z., Li, J., & Zhao, Z., 2019, Cementation and porosity evolution of tight sandstone reservoirs in the Permian Sulige gas field, Ordos Basin (central China): Marine and Petroleum Geology, 103, 276–293. http://dx.doi.org/10.1016/j.marpetgeo.2019.02.010
García, M., Mier, R., Arias, A., Cortés, Y., Moreno, M., Salazar, O., Jiménez, M, 2008, Prospectividad de la Cuenca Cesar-Ranchería: Grupo de Investigación en Geología de Hidrocarburos y Carbones, Universidad Industrial de Santander (UIS), Bucaramanga, Colombia.
Gier, S., Worden, R. H., Johns, W. D., Kurzweil, H, 2008, Diagenesis and reservoir quality of Miocene sandstones in the Vienna Basin, Austria: Marine and Petroleum Geology, 25(8), 681–695. https://doi.org/10.1016%2Fj.marpetgeo.2008.06.001
Gunter, G. W., Pinch, J. J., Finneran, J. M., Bryant, W. T., 1997a, Overview of an Integrated Process Model to Develop Petrophysical Based Reservoir Descriptions: SPE Annual Technical Conference and Exhibition, 1997, 38748, 475-479. https://doi.org/10.2118%2F38748-ms
Gunter, G.W., Finneran, J.M., Hartmann, D.J., Miller, J.D., 1997b, Early determination of reservoir flow units using an integrated petrophysical method: Proceedings of the SPE Annual Technical Conference and Exhibition, Oct. 5-8, San Antonio, TX, 373-381. https://doi.org/10.2118/38679-MS
Gunter, G. W., Spain, D. R., Viro, E. J., Thomas, J. B., Potter, G., Williams, J., 2014, Winland pore throat prediction method-a proper retrospect: New examples from carbonates and complex systems: SPWLA 55th Annual Logging Symposium. Society of Petrophysicists and Well-Log Analysts.
Habib, A., Islam, T., Md, A. R., 2014, Paleoenvironmental reconstruction of Miocene Surma succession in the well Rashidpur # 04 of Bengal Basin using log facies interpretation: Iranian Journal of Earth Sciences, 6(1), 12-23.
Hartmann, D. J., Coalson, E. B., 1990, Evaluation of the Morrow Sandstone in Sorrento Field, Cheyenne County, Colorado, in S. A. Sonnenberg, L. T. Shannon, K. Rader, W. F. Von Drehl, y G. W. Martin (Eds), Morrow Sandstones of Southeast Colorado and Adjacent Areas, The Rocky Mountain Association of Geologists, Denver, Colorado, 91 - 100 p.
Islam, M. A., 2010, Petrophysical evaluation of subsurface reservoir sandstones of Bengal Basin, Bangladesh: Journal of the Geological Society of India, 76(6), 621–631. https://doi.org/10.1007%2Fs12594-010-0122-9
Khanam, F., Rahman, M. J. J., Alam, M. M., Abdullah, R., 2017, Facies characterization of the Surma Group (Miocene) sediments from Jalalabad gas field, Sylhet trough, Bangladesh: Study from cores and wireline log: Journal of the Geological Society of India, 89(2), 155–164. https://doi.org/10.1007%2Fs12594-017-0579-x
Krueger, W.C., 1968, Depositional Environments of Sandstones as Interpreted from Subsurface Measurements--an Introduction: American Association of Petroleum Geologists Bulletin, 52(9), 1827-1827. https://doi.org/10.1306%2F5d25c4e9-16c1-11d7-8645000102c1865d
Lee, S. H., Kharghoria, A., Datta-Gupta, A., 2002, Electrofacies Characterization and Permeability Predictions in Complex Reservoirs: SPE Reservoir Evaluation & Engineering, 5(03), 237–248. https://doi.org/10.2118%2F78662-pa
Liu, L., Zhang, J., Wang, J., Li, C., Yu, J., Zhang, G., Wang, G, 2015, Geostatistical modeling for fine reservoir description of Wei2 block of Weicheng oilfield, Dongpu depression, China: Arabian Journal of Geosciences, 8(11), 9101–9115. https://doi.org/10.1007%2Fs12517-015-1924-2
Mahjour, S. K., Al-Askari, M. K. G., Masihi, M., 2016, Flow-units verification, using statistical zonation and application of Stratigraphic Modified Lorenz Plot in Tabnak gas field: Egyptian Journal of Petroleum, 25(2), 215-220. https://doi.org/10.1016/j.ejpe.2015.05.018
Mansurbeg, H., Morad, S., Salem, A., Marfil, R., El-ghali, M. A. K., Nystuen, J. P., La Iglesia, A., 2008, Diagenesis and reservoir quality evolution of palaeocene deep-water, marine sandstones, the Shetland-Faroes Basin, British continental shelf: Marine and Petroleum Geology, 25(6), 514–543. https://doi.org/10.1016%2Fj.marpetgeo.2007.07.012
Maze, W. B., 1984, Jurassic La Quinta Formation in the Sierra de Perijá, northwestern Venezuela: Geology and tectonic environment of red beds and volcanic rocks: The Caribbean-South American Plate Boundary and Regional Tectonics, 263–282. https://doi.org/10.1130%2Fmem162-p263
Mesa, A., Rengifo, S., 2011, Cesar-Ranchería Basin. Medellín, Colombia: ANH-University EAFIT, Departamento de Geología, 6, 157.
Momta, P. S., Etu-Efeotor, J. O., Ugwueze, C. U., 2015, Petrophysical Characterization and Flow Models for Agbada Reservoirs, Onshore Niger Delta, Nigeria: American Journal of Geoscience, 5, 40-52. https://doi.org/10.3844/ajgsp.2015.40.52
Mondal, D., Islam, M. S., Islam, M. A., 2009, Electrofacies analysis of Neogene sequence in the well Shahbazpur# 1, Bhola, Bengal Basin: ICFAI Journal of Earth Sciences, 3(1), 57-74.
Montes, C., Guzman, G., Bayona, G., Cardona, A., Valencia, V., Jaramillo, C., 2010, Clockwise rotation of the Santa Marta massif and simultaneous Paleogene to Neogene deformation of the Plato-San Jorge and Cesar-Ranchería basins: Journal of South American Earth Sciences, 29(4), 832-848. https://doi.org/10.1016%2Fj.jsames.2009.07.010
Morón, S., Montes, C., Jaramillo, C., Bayona, G., Sánchez, C., 2007, Ciclicidad en la Formación Cerrejón: Boletín de Geología, 29(1). https://doi.org/10.18273%2Frevbol
Orodu, O. D., Tang, Z., Fei, Q., 20016, Hydraulic (Flow) Unit Determination and Permeability Prediction: A Case Study of Block Shen-95, Liaohe Oilfield, North-East China: Journal of Applied Sciences, 9(10), 1801–1816. https://doi.org/10.3923%2Fjas.2009.1801.1816
Perez, H. H., Datta-Gupta, A., Mishra, S., 2005, The Role of Electrofacies, Lithofacies, and Hydraulic Flow Units in Permeability Predictions from Well Logs: A Comparative Analysis Using Classification Trees: SPE Annual Technical Conference and Exhibition, 8(02), 143-155. https://doi.org/10.2118%2F84301-ms
Prélat, A., Hodgson, D. M., Hall, M., Jackson, C. A.-L., Baunack, C., Tveiten, B., 2015, Constraining sub-seismic deep-water stratal elements with electrofacies analysis; A case study from the Upper Cretaceous of the Måløy Slope, offshore Norway: Marine and Petroleum Geology, 59, 268–285. https://doi.org/10.1016%2Fj.marpetgeo.2014.07.018
Quandt, D., Trumbull, R. B., Altenberger, U., Cardona, A., Romer, R. L., Bayona, G., Guzmán, G., 2018, The geochemistry and geochronology of Early Jurassic igneous rocks from the Sierra Nevada de Santa Marta, NW Colombia, and tectono-magmatic implications: Journal of South American Earth Sciences, 86, 216–230. https://doi.org/10.1016%2Fj.jsames.2018.06.019
Ramón, J. C., Cross, T., 1997, Characterization and prediction of reservoir architecture and petrophysical properties in fluvial channel sandstones, middle Magdalena Basin, Colombia: CT&F-Ciencia, Tecnología y Futuro, 1(3), 19-46.
Richardson, A. A. M., 2013, Well correlation and petrophysical analysis, a case study of “Rickie” Field Onshore Niger Delta: The International Journal of Engineering and Science, 2(12), 94-99.
Rider, M.H., Kennedy, M., 2011, The geological interpretation of well logs. Gulf Pub Co: USA.
Ross-Coss, D., Ampomah, W., Cather, M., Balch, R. S., Mozley, P., Rasmussen, L., 2016, An improved approach for sandstone reservoir characterization: SPE Western Regional Meeting, Society of Petroleum Engineers. https://doi.org/10.2118/180375-MS
Sánchez, J., Mann, P., 2015, Integrated Structural and Basinal Analysis of the Cesar–Ranchería Basin, Colombia: Implications for its Tectonic History and Petroleum Systems, in: Petroleum geology and potential of the Colombian Caribbean Margin: AAPG Memoir; Bartolini, C., Mann, P., Eds.; AAPG: Tulsa, OK, USA, 108, 431–470. https://doi.org/10.1306%2F13531945m1083648
Schlumberger, 2000, Schlumberger log interpretation charts: Sugar Land, Texas, Schlumberger Oilfield Communications, SMP-7006, 194 p.
Servicio Geológico Colombiano, 2015, Mapa geológico de Colombia, Escala 1:2,000,000 Bogotá, Colombia.
Simandoux, P., 1963, Dielectric measurements on porous media application to the measurement of water saturations: study of the behaviour of argillaceous formations: Revue l’Institut Francais Petroleum, 18, 193-215.
Tada, R., Siever, R., 1989, Pressure solution during diagenesis: Annual Review of Earth and Planetary Sciences, 17, 89-118. https://doi.org/10.1146%2Fannurev.ea.17.050189.000513
Taylor, T., 1990, The Influence of Calcite Dissolution on Reservoir Porosity in Miocene Sandstones, Picaroon Field, Offshore Texas Gulf Coast: SEPM Journal of Sedimentary Research, 60(3), 322-334. https://doi.org/10.1306%2F212f9192-2b24-11d7-8648000102c1865d
Taylor, T. R., Kittridge, M. G., Winefield, P., Bryndzia, L. T., Bonnell, L. M., 2015, Reservoir quality and rock properties modeling – Triassic and Jurassic sandstones, greater Shearwater area, UK Central North Sea: Marine and Petroleum Geology, 65, 1–21. https://doi.org/10.1016%2Fj.marpetgeo.2015.03.020
Tiab, D., Donaldson, E.C., 2015, Petrophysics: theory and practice of measuring reservoir rock and fluid transport properties: Elsevier,USA.
Tschanz, C. M., Marvin, R. F., Cruz, B, J., Mehnert, H. H., Cebula, G. T., 1974, Geologic evolution of the Sierra Nevada de Santa Marta, northeastern Colombia: Geological Society of America Bulletin, 85(2), 273-284. https://doi.org/10.1130/0016-7606(1974)85<273:geotsn>2.0.co;2
Waksmundzka, M. I., 2013, Carboniferous coarsening-upward and non-gradational cyclothems in the Lublin Basin (SE Poland): paleoclimatic implications: Geological Society, London, Special Publications, 376(1), 141-175. https://doi.org/10.1144%2Fsp376.18
Walderhaug, O., 1996, Kinetic modeling of quartz cementation and porosity loss in deeply buried sandstone reservoirs: AAPG Bulletin, 80(5), 731-745. https://doi.org/10.1306%2F64ed88a4-1724-11d7-8645000102c1865d
Windland, H. D., 1972, Oil Accumulation in Response to Pore Size Changes, in Weyburn Field, Sastkatchewan: Amoco Production Research Report, No F72-G-25.
Wróblewska, S.M., Kozłowska, M., 2019, Influence of primary composition and diagenetic mineralization on natural gamma-ray and density logs of Carboniferous sandstones of the Dęblin Formation: Geological Quaterly, 63(4). https://doi.org/10.7306%2Fgq.1498
Wu, W.,Grana, D., 2017, Integrated petrophysics and rock physics modeling for well log interpretation of elastic, electrical, and petrophysical properties: Journal of Applied Geophysics, 146, 54–66. https://doi.org/10.1016%2Fj.jappgeo.2017.09.007
Manuscript received: July 10, 2020
Corrected manuscript received: November 23, 2020
Manuscript accepted:December 14, 2020
Peer Reviewing under the responsibility of Universidad Nacional Autónoma de México.
This is an open access article under the CC BY-NC-SA license(https://creativecommons.org/licenses/by-nc-sa/4.0/)