
|
Boletín de la Sociedad Geológica Mexicana Volumen 75, núm. 3, A130923, 2023 http://dx.doi.org/10.18268/BSGM2023v75n3a130923
|
 |
Geological significance of the spatial clustering and alignment of vents in zones of distributed volcanism: A critical review
Importancia geológica de la agrupación espacial y alineación de surgencias en zonas de volcanismo distribuido: Una revisión crítica
Edgardo Cañón-Tapia1,*
1 CICESE- División de Ciencias de la Tierra. Carretera Ensenada-Tijuana # 3918, 22860, Ensenada Baja California, Mexico.
* Corresponding author: (E. Cañón-Tapia) This email address is being protected from spambots. You need JavaScript enabled to view it.
How to cite this article:
Cañón-Tapia, E., 2023, Geological significance of the spatial clustering and alignment of vents in zones of distributed volcanism: A critical review: Boletín de la Sociedad Geológica Mexicana, 75 (3), A130923. http://dx.doi.org/10.18268/BSGM2023v75n3a130923
Manuscript received: July 31, 2023; Corrected manuscript received: September 8, 2023; Manuscript accepted: September 11, 2023.
ABSTRACT
The spatial distribution of volcanic activity has been the subject of scientific enquiry for more than 350 years. Nevertheless, it has been only until recently that modern techniques of analysis started to be used to characterize such distribution. As a result, in the past 40 years many methods were devised, or adopted from other fields of study, aiming to achieve that purpose. Ironically, the plethora of now available methodologies has made problematic the selection of one method of study to characterize the spatial distribution of volcanic vents. In addition, given the diversity of methods, and their underlying assumptions, there are issues concerning the form in which the results of any specific method should be interpreted in a volcanic context. In this work I make emphasis on the relationship between the embedded assumptions of several common methods of study with the concept of a “natural partition”. Throughout this work it is remarked that 1) it is extremely important to gain conscience about the several assumptions implicit on each method of analysis, 2) never loose sight that not all volcanic systems are equal, and 3) that it is a myth that any quantitative method can provide reliable information about any system. The convenience of assessing more than one conceptual model to explain the formation of a cluster-subcluster structure is also mentioned. Overall, it is shown that the complexity of volcanic phenomena cannot be encapsulated by using a single method of study, or an automatized selection of parameters. Thus, given the complexity and diversity of volcanic phenomena, there is no particular method, nor set of methods, that can be recommended to be used on every situation of interest. Yet, as a golden rule, it is suggested that more than one method of analysis is used at every location of study, looking for congruency of results within a range of spatial scales.
Keywords: spatial distribution of volcanic centers, volcanic fields.
RESUMEN
La distribución de actividad volcánica ha atraído la atención de la humanidad por más de 350 años. Sin embargo, solamente hasta hace pocos años se comenzaron a usar técnicas de estudio modernas y con un contenido estadístico riguroso en el sentido de la ciencia de nuestros días. De hecho, se han creado tantos métodos de estudio que el problema actualmente no es la falta de una metodología de estudio moderna, sino la selección del método más adecuado, así como la forma en la que los resultados de ese método son interpretados. En este trabajo se examinan algunos de los métodos más comunes de los últimos 40 años, poniendo un énfasis especial en las suposiciones inherentes a cada método. Durante dicha revisión se pone de manifiesto que es fundamental tener conciencia de las suposiciones propias de cada método para evitar caer en la creación de mitos o falacias que solamente están basadas en prejuicios metodológicos que tienen la apariencia de ser cuantitativos y por lo mismo no-sesgados y muy exactos. También se muestra en este trabajo la conveniencia de manejar más de un modelo conceptual en cada zona de estudio, en particular en lo concerniente a la formación de agrupaciones anidadas. Normalmente es imposible capturar la complejidad de un sistema volcánico usando un solo método de estudio, o una aproximación automatizada. Por lo tanto, la regla dorada parece ser la utilización de más de un método de análisis teniendo cuidado de que haya congruencia en los resultados obtenidos a diferentes escalas espaciales.
Palabras clave: distribución espacial de centros volcánicos, campos volcánicos.
- Introduction
The spatial distribution of volcanic activity has been a subject of enquiry since at least the 17th century when their global character was conceptually illustrated by Kircher (1678). Nevertheless, modern techniques of spatial analysis (mostly aiming to characterize patterns on the spatial distribution of the observed, or mapped objects) were applied to the study of the distribution of magmatic complexes until the 20th century, by Lutz (1986). Soon after, Wadge and Cross (1988) described a different set of techniques of spatial analysis, specifically designed to detect alignments within a set of point-like features, applying them to volcanic contexts. The works by Lutz (1986) and Wadge and Cross (1988) exemplify the basic differences in the form in which the various techniques associated with studies of the spatial distribution of volcanic vents have been applied in modern times. One of those differences concerns the aims of the selected method: for some authors, there is an unsurmountable difference between techniques aiming to detect clusters and techniques aiming to detect lines. Other authors, however, consider that all methods of spatial analysis can be considered as part of a large family of methods. A more important difference between works concerns the form in which the specific results of any method are interpreted in relation to the geologic constraints.
On the one hand, Lutz (1986) emphasized that tests of spatial correlation may have no clear geological relevance even if the test indicates a departure from randomness. In contrast, Wadge and Cross (1988) implied that any departure from randomness supported by a statistical test should be considered as potentially relevant in a geologic context. Thus, a dichotomy in the interpretation of methods of spatial analysis became subtly established among the community. As a result, on the one hand statistical tests can be interpreted as useful constrains of hypothesis of geologic relevance (hypotheses that always needed to be carefully evaluated to the light of the local geologic structures). On the other hand, the statistical results are considered to capture certainties that reflect a geological or structural reality (reality that even if not evident at the time of study, is simply waiting for more geologic data to be confirmed).
Ideally, an equilibrium between geologic and statistical models should exist. Thus, any statistical test should indeed have a direct relationship with a geological feature. However, such direct relationship is not always present. Consequently, very often we face situations in which a decision must be taken in the sense of which type of statistical or conceptual model should be given more weight. A geologic model with no statistical support is somewhat questionable, but a statistical model without geologic support becomes a mere abstraction that may be entirely disconnected from the physical world. Either of those two options is not satisfactory.
Historically, statistical models have been gradually given more weight than geologic approaches (Oldroy, 1996). Unfortunately, overemphasizing statistical models sometimes may lead to the acceptance of hypotheses that not only have no direct support from the geologic evidence, but may even contradict the scarce geologic evidence available. Also, overemphasis on the statistical results may also preclude the exploration of alternatives that could be more congruent with the geologic reality but that are not sufficiently sampled in a statistical sense, and therefore are entirely dismissed without further enquiry. Thus, somewhat Ironically, the blind use of statistical (or automatized) models may hamper progress of the understanding of geologic phenomena. The best form to avoid such dangers is to have always present the assumptions that are embedded in a particular statistical model, and to compare them with the geologic reality that is present on the specific case under examination.
In this work I provide an overview of the uses and limitations of several methods used for the study of the spatial distribution of volcanic vents, making emphasis on the assumptions embedded in those methods. Several of these issues have been addressed to different degrees elsewhere (Cañón-Tapia, 2016; Cañón-Tapia, 2020; Cañón-Tapia, 2021a; Cañón-Tapia, 2022). Nevertheless, it seems convenient to make an abridged revision of the most important concepts in a single place to facilitate the appreciation of the utility of this type of studies.
- Earlier work
Soon after the works of Lutz (1986) and Wadge and Cross (1988), studies of the spatial distribution of volcanoes started to incorporate different methods of analysis. For example, Connor (1987) incorporated the results of an statistical analysis of the distribution of volcano heights in his analysis of the spatial distribution of volcanoes in the Michoacán-Guanajuato Volcanic Field, Mexico. Subsequently, methods of cluster analysis (single linkage, weighted centroid), alignment analysis (two-point azimuth, Hough transform, two-dimensional Fourier) and nearest neighbor analysis (Hopkins F test, Clark-Evans test) started to be combined in a single study to characterize the distribution of vents in a given region (Connor, 1990; Connor and Hill, 1995; Connor et al., 1992). The underlying rationale of all these studies was the idea that clustering methods could be used to map natural clusters, and that once those clusters had been delineated, it is possible to discuss their similarities and differences in a meaningful form. Thus, the differences and similarities among clusters could be related with the orientation of alignments or nearest neighbor distances, or with other type of information such as rock or mineral composition, age of activity, etc. In any case, cluster identification passed to be a preponderant component of studies of the spatial distribution of vents among other things, because it provided the background upon which the results of other methods of spatial analysis should be produced and further interpreted.
Lutz and Gutmann (1995) also combined different methods of analysis in one study, introducing the estimation of kernel density to the analysis of the spatial distribution of volcanic vents. In their work, they point out that by selecting different values of a kernel parameter (called by them the “half width”, but more commonly referred in later literature as the “smoothing factor”), it was possible to create different density models that resolve features of the data at different spatial scales. Furthermore, they also showed that the analysis of different scales could be important because it could highlight small-scale features that were subdued by an analysis completed at only the largest of scales.
Again, the several works by Connor on the one hand, and the work by Lutz and Gutman on the other hand, exemplify the underlying dichotomy in the weight given to the geologic and statistical models mentioned above. As a result, many different methods started to be utilized in a single study looking for a refinement of the statistical results, promoting a subtle drifting away from the geological observations. On the other hand, the method of analysis remained to be used as an auxiliary on the exploration of possible geologic relations that could be observed at different scales. For one reason or another, works reporting explorative aspects of the distribution of volcanic vents gradually faded into disrepute, to the extent that many years later this methodological approach was deemed as outdated and prone to bias due to its “subjective” nature, recommending its replacement by a more modern approach that minimizes the error in the determination of a unique spatial density model that has a statistically assured significance (Connor et al., 2019). Thus, an approach that could be called preponderantly statistical (albeit it should be more accurately called automatized), gradually become the standard of the studies of the spatial distribution of volcanism. Unfortunately, with the gradual preponderance gained by the statistic approach, the extent to which natural clusters in volcanic contexts do really exist, ceased to be a subject of enquiry. As a counterbalance to this trend, the remainder of this work is addressed to investigate to what extent methods of analysis are truly revealing something geologically significant about volcanic systems.
- How natural are volcanic clusters?
3.1 GENERAL CONSIDERATIONS
The main problem underlying the identification of “natural” clusters, is that in a general sense there is not a unique definition for what should be considered as “natural”. In the context of the application of methods of cluster analysis to the identification of natural groups of volcanic vents (or of magmatic centers), the non-uniqueness of a “natural” division relies on the various parameters that may be of geological significance. For example, from the point of view of a petrologist, it may seem natural to define the groups of volcanoes in terms of the mineral composition of the erupted products. This criterion alone might provide important information concerning the source of the magma feeding the regional volcanic activity. Nevertheless, this criterion, alone, does not provide information that can serve us to assess the rates of eruption characteristic of that region. To this end, we need to rely on a different source of information, as for example isotopic dates or stratigraphic position of the erupted products (Martí et al., 2018; Németh and Palmer, 2019). Of course, if attention is focused exclusively on the age-related information, we would be able to define groups based on age of activity. Certainly, each of the petrologically defined groups and each of the age-defined groups may seem very natural. Nevertheless, there is no guarantee that we will be able to establish a neat correlation between the petrologically-defined and age-defined groups. Consequently, the “natural” groupings become less natural when both sources of information are considered simultaneously. If it is further considered that petrologic and age-related information are not the only pieces of information that are important on the study of volcanism, the departure from a “natural” group becomes more marked. For example, a third source of information that might be useful to consider is the size of the volcanic edifices. As it is the case with each of the petrologic and age-related criteria, the size-related classification should be enough to identify a set of “natural” groups if considered in isolation, but the number of those groups, and the volcanoes that belong to each of them, may not have a simple correlation with the petrologic and age-related partitions. Evidently, if other criteria, such as morphology of the edifices, volume of erupted products, proportion of pyroclastic/lavas erupted, etc. are to be considered at some time during our analysis, the case for a “natural” definition of a cluster of volcanic vents becomes ever weaker.
Even if attention is focused on only spatial location of eruptive centers, it might be difficult to identify a “natural” partition. For example, let us think of a polygenetic volcano that has experienced eruptive episodes from three radial rift zones (Figure 1). The question here is what should be considered to be more natural: a) one cluster that includes all the vents and suggests a single, almost concentric distribution, b) two clusters located on top of the two rift zones that have the larger number of eruptive vents, c) three clusters located each on top of a rift zone, d) four clusters, three each on top of a rift zone and a fourth group surrounding the vents near the central conduit, e) a larger number of clusters that delineate the location of the three rift zones and the central conduit, as well as also serving to identify departures from a simple radial pattern in one of the rift zones, f) a structure that reveals the same components as e) plus a few clusters in the outskirts of the main edifice, etc. As it turns out, all of those spatial structures can be documented in one specific case (Mauna Kea volcano, Hawai’i). Thus, each of the mentioned alternatives is physically possible, and has a relevant geologic interpretation. Therefore, it is unclear which of the alternative grouping schemes should be considered more “natural” than the others.
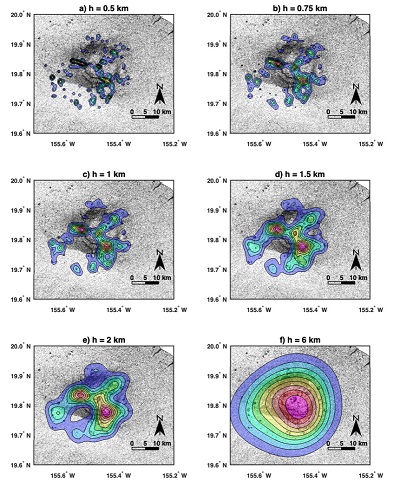 |
| Figure 1. Diagrams showing different clustering options that can be achieved when analyzing the vent distribution of cinder cones on top of Mauna Kea Volcano (Cañón-Tapia, 2022). Each grouping scheme is found using a Gaussian Kernel with a smoothing factor as indicated by the value of h on top of each diagram. A similar range of h values is obtained when using different automatization algorithms. The location of eruptive centers on top and around Mauna Kea were obtained from Google Earth, and saved as a MATLAB file. Background image produced by using a section of the SRTM 1arc_v3 geotif downloaded from the USGS Earth Explorer server. A total of 242 vents were used on the analyses. |
3.2 SOME TECHNICAL DIFFICULTIES
In addition to the problems found when attempting to define what should be the natural spatial structure of vent distribution at a given place, there are other issues related with the methods of analysis that need to be examined. Historically, most works documenting the spatial distribution of volcanic vents published prior to 2020 adopted an approach that privileged the statistical interpretation of results, assuming that the method selected for the spatial analysis had no influence on the outcome (Bleacher et al., 2009; Kiyosugi et al., 2012; Kiyosugi et al., 2009; Magill et al., 2005; Martin et al., 2003; Weller et al., 2006). Although indeed, not all of those works explicitly aimed to identify clusters of vents, the groupings used on each of those works were justified by the use of a unique method of analysis, often based on an “optimal” value of the smoothing factor in a kernel function. This is not the place to examine whether the conclusions reached on each of those studies is truly geologically significant or not. Nevertheless, the example of Mauna Kea volcano described at the end of the previous section should suffice to make us realize several issues: 1) even when it might be tempting to focus in only one solution, such procedure not necessarily captures all the relevant characteristic of the volcanic activity on the region of study, 2) the interpreted outcome may not be the only situation of geological significance, and 3) other interesting relationships not revealed by the “optimal” statistical approach might be waiting for discovery.
Consequently, it is of interest to undertake a closer examination of the technical aspects concerning the form in which the “optimal” spatial structure that minimizes “error” has been commonly selected. To facilitate their presentation, the technical aspects concerning the selection of an “optimal” spatial structure will be separated below in two broad groups: those concerning the selection of a method of analysis to isolate the unique spatial structure that will be further analyzed and those concerning the selection of an optimal parameter to be used with a single method. Among the second group, I will focus on the form in which the selection of an optimal smoothing factor has been decided in a kernel method.
3.2.1 METHOD SELECTION
In the following, “clustering” will be used as a general term that denotes some type of grouping. This grouping may include “lines” or “bands” of vents, which essentially are groups that satisfy certain conditions about their relative position. Consequently, the method selection alluded in this section encompasses all methods of analyses falling within the broad categories of cluster and alignment detections.
In the most general sense, cluster analysis deals with the many forms in which a set of objects can be divided (or classified) into homogeneous groups (clusters) so that any two objects belonging to the same group are more “similar” to each other than any two objects that belong to different groups (Everitt et al., 2011; Wierzchon and Klopotec, 2018). At an operative level, cluster analysis is a series of procedures aiming to reveal any structure (or pattern) that might be present in a set of data, often in an abstract, multivariate space in which some sort of proximity is quantified. Many alternative procedures (methods, algorithms) have been developed with applications in a large number of scientific research and even marketing fields (Estivill-Castro, 2002; Fahad et al., 2014; Jain and Dubes, 1988). Most methods of cluster analysis incorporate some type of expectation about the structure of the data. Consequently, the method employed for the analysis might influence the outcome in different forms, even if the operator acts on the assumption that the selected method is entirely objective.
From a general perspective, there are different forms in which clusters can be operatively defined. Each of these forms makes emphasis on aspects of connectivity, geometry distribution, density variations, etc. Thus, some algorithms are designed to find clusters that have a prescribed shape (e.g., in 2D space we may consider that the cluster is circular, ellipsoidal, linear, etc.), whereas other algorithms are better suited to find a pre-determined number of clusters within a data set regardless of their shape or density of observations within the group, and yet other algorithms might favor the identification of clusters as regions that exceed a pre-determined density of observations regardless of the shape of the area enclosing them, or of the number of observations that is included within a given group. Consequently, there is no algorithm that can be considered as better than the rest in all possible situations (Wierzchon and Klopotec, 2018).
Other aspects that need to be considered concern the possibility of having observations that are ambiguously associated with some groups (i.e., one observation may be part of more than one group even if there is some level of confidence associated with each possibility), as well as the form in which outliers are incorporated in the spatial structure. Depending on our choices, the selected clustering method can therefore be considered to be of a hard or soft (fuzzy) nature, it might include strict partitioning rules with or without outliers allowed, it may allow overlapping clusters or it may be entirely hierarchical in nature. Commonly, all of those decisions are taken either consciously or subconsciously when a particular method of analysis is selected. Also, whether it is explicitly acknowledged or not, each of those selections is likely to influence the outcome of the analysis.
3.2.2 SELECTION OF AN “OPTIMAL” PARAMETER
Every method of spatial analysis uses various parameters to complete its task. Most clustering methods require previous knowledge of the number of groups that will be searched, alignment detection requires constraints about the length of the line or the tolerance with which the “line” should be defined, density-based methods require indications about the search radius or neighbor of reference, etc. Outcomes of each method are therefore always parameter-dependent. Confusion on this subject may arise when a method is said to be non-parametric. For example, the kernel method is often referred to as a non-parametric estimator of a density function (Minnotte, 1997; Rosenblatt, 1956). The non-parametrization in this case refers to the parameters “mean”, “standard deviation”, and “variance” which are required to specify a statistical distribution. Indeed, those statistical parameters are not required to produce an estimation based on a kernel function. Nevertheless, the estimation requires a different parameter variously called “bandwidth”, “smoothing factor”, “search radius” etc. Thus, in the strictest sense, even the kernel method is parameter-dependent.
Given the dependency of all methods of spatial analysis on some parameter, the problem of selecting one parameter to report the results of the analysis will always be present. This problem was described very clearly by Silverman (1986) for the case of the kernel method: “It should never be forgotten that the appropriate choice of smoothing parameter will always be influenced by the purpose for which the density estimate is to be used”. He went further to identify the two main approaches: “If the purpose … is to explore the data in order to suggest possible models and hypotheses, then it will … be … indeed desirable, to choose the smoothing parameter subjectively …. If density estimation is to be used on a larger number of data sets or as part of a larger procedure, then an automatic method is essential”. The following precision given by Silverman, however, seems to have been overlooked in many occasions: “In this discussion I have deliberately used the word automatic rather than objective”. This precision is important because the automatic selection of a parameter based on the data themselves became to be considered as a measure of objectivity, and therefore more desirable than a subjective approach. The opinion of Silverman (1986) about this issue is very clear from the following two statements: “The inexperienced user will doubtless feel happier if the method is fully automatic” and “Behind the process of automating statistical procedures completely always lies the danger of encouraging the user not to give enough consideration to prior assumptions”.
In any case, the above quotes taken from the work by Silverman (1986) indicate that the already alluded dichotomy in approaches in which more weight is given either to the geological evidence or to the statistical tests is also an issue when deciding the value of the parameter that should be used to complete the spatial analysis. Jones et al. (1996a) provide a different perspective of the reasons for this dichotomy pointing out that there are several reasons why it is important to have a method for the automatic selection of a smoothing factor. Those reasons include the need for software packages to have a default value to make an initial calculation, and situations in which a large number of estimates is required such that it is impractical to manually select smoothing parameters. Furthermore, when referring to the need to have a sensible starting point, Jones et al. (1996a) indicate that this would be useful in saving time to the expert user, but that such approach is “imperative when smoothing is used by nonexperts”. Thus, according to these authors the automatized selection of a parameter to insert on the method of spatial analysis should be considered more a matter of convenience than of actual optimization in the sense of having a parameter that truly reduces the error (or equivalently, guarantees the truth) of the obtained result.
Further aspects concerning the inadequacy of equating automatic selection with optimization in the sense of “reducing error” were detailed by Jones et al. (1996b) when referring specifically to the procedure known as MISE (Mean Integrated Square Error). Specifically, they indicated that “although there are appealing conceptual arguments for working with ISE, a purely data-based bandwidth selection procedure does not have the information to be expected to behave very well in those terms”, and although the inclusion of the M in the estimator might result in a more realistic target, “there are arguments for and against including the M at all”. Unfortunately, all those considerations seem to have been overlooked in many works dealing with the application of this method to the study of volcanic vent distributions.
Yet a different perspective on this issue has been offered by Cañón-Tapia (2022) who showed that even when approached from a very pragmatic point of view in which several automatized estimators of the smoothing parameters are used, it is necessary to make a subjective choice of selector because different automatization methods might lead to contrastingly different values of the “optimal” smoothing parameter. Consequently, it should be clear that focusing on only one outcome of a single method of spatial analysis is far from being the optimal solution to describe the complexity of most situations likely to be encountered in volcanic contexts. As a result, the conclusion must be reached in the sense that there is no simple form to identify a “natural” spatial structure from the examination of the distribution of volcanic vents.
- If there are no naturally defined volcanic clusters, do we have to explore an infinite number of possibilities?
Accepting that there is no unique answer to the question of “what is the spatial structure of the data under examination?” might open the door for an infinite number of possible alternatives. Evidently, nobody has an infinite amount of time or resources to explore all the possible alternatives for each case of interest. Consequently, it is convenient to keep the number of alternative outcomes considered as relevant within a manageable number. Although there is no universal recipe that guarantees us that we are going to examine only the most relevant scenarios (using the most relevant /appropriate methods), it is useful to consider adoption of two broad alternatives, both of which will be described in detail in the following subsections. One approach is to consider that if there is anything closely resembling a “natural” partition, it should be hinted at by several methods of analysis that are different in some basic aspects. This approach therefore relies on the convergence of results obtained through different methods of study. The second methodological approach is to pay close attention to causal relations that can be used to refine the selection of the methods of analysis. This approach is examined on the section of Geological constraints.
4.1 CONVERGENCE OF DIFFERENT METHODOLOGIES
Although it might be considered that there are fundamental differences that distinguish the many methods available for the study of spatial distributions (alignment detection, cluster identification, spatial statistics, etc.), all of these methods share the objective of providing a summary of the distribution that should facilitate its association with a probable causal agent. Thus, despite their inherent technical differences, it might be possible to use two or more of those methods to detect the underlying pattern that might point to the presumed causal agent. Evidently, combination of methods that belong to a similar category (for example different algorithms used to define clusters) is easier than the combination of methods that belong to different categories (for example one method of cluster analysis with one designed to detect alignments, or one method that yields results in the form of numerical statistics with another method that provides results of a more graphical nature). Nevertheless, if attention is focused on the common aspects of both methods, a fruitful combination can be devised.
An example of the form in which different methods belonging to the same category can be used to constrain the possible number of outcomes deemed of relevance, is the definition of the so-called core-groups. A core-group was defined by Cañón-Tapia (2020) as the common output of more than two clustering methods applied to obtain partitions from a collection of vents whose geographic coordinates are known. As shown on that paper, the common outcome of several clustering algorithms (agglomerative with different linkage definitions, k-means, k-medoids, gaussian-model) yields more significant results in a geologic context than either of those algorithms used alone. Consequently, the location of the groups that might have more relevance in a geologic context can be constrained more or less efficiently by adopting such approach. Unfortunately, a condition required for the use of core-groups is that the number of groups needs to be specified at the beginning of the analysis, and in most situations of volcanic interest, the number of relevant groups is hard to be known with certainty at the beginning. Furthermore, as exemplified by the case of Mauna Kea volcano illustrated above, such number might be different depending on the scale at which the analysis is made.
4.1.1 CONSTRAINING THE NUMBER OF CLUSTERS
To constrain the number of groups that should be considered relevant, it is possible to resort to one method whose results are relatively easy to visualize: the gaussian kernel estimator. As a general rule, a large smoothing factor in the gaussian kernel should yield a unimodal distribution (marked by a single set of concentric contour lines, as in figure 1f), and a small smoothing factor should yield a large number of groupings (marked by many different sets of concentric contour lines, and some contours that are not concentric in relation to others, as in figure 1a). The rate of increase of the number of modes in the resulting distribution is not lineal, nor monotonic, but commonly four or five attempts should suffice to constrain the values of the smoothing factor that are likely to bracket the number of clusters that seems convenient to consider with more detail. An additional advantage of using this method to constrain the number of clusters of interest is that it also provides some indication of the location of those clusters, location that can also be compared at a later stage with that obtained with the use of the core-groups, as shown in figure 2. Agreement between the kernel and core-groups methods therefore increases the probability of identification of the groups with more geological relevance.
 |
| Figure 2. Comparison of the groupings identified using the Core-Groups method (CG) and the zones of higher vent density identified with the Gaussian kernel (PDF), when analyzing the vent distribution in the island of Jeju, North Corea (Cañón-Tapia, 2021b). Some of the core groups coincide with the kernel clusters, but some do not. This result suggests the possibility of a sub-clustered structure. Vent location obtained by examination of Google Earth images, combined with the location of vents indicated in the maps by Song et al. (2018), Sohn and Park (2005), and the Digital Elevation Model STRM 1 arc-second downloaded from https:// earthexplorer.usgs.gov. A total of 304 edifices were included in the analysis. All data were processes using MATLAB codes. |
A clustering algorithm noted by its versatility, known as HDBSCAN (Hierarchical Density Based Clustering Algorithm with Noise), is similar in many respects to an exploratory analysis made with the gaussian kernel using different values of the smoothing factor. In both cases zones of high density of data are identified. The difference in the methods consists in the form in which the evolution of those zones of high density are handled and displayed. To obtain results with the HDBSCAN it is necessary to specify a minimum number of members to be considered as a relevant group, whereas such specification is not required on the kernel approach. In the HDBSCAN algorithm, the minimum membership is used to trim the hierarchical tree of clusters, and only those branches that have at least the required number of members are retained. The visualization of this process is thus made in a two-dimensional diagram in which clusters and subclusters are shown as branches on a dendrogram, but no clear reference is made in regards the spatial location of those branches. In contrast, in the kernel approach the branches are not trimmed, and the spatial location of each group is always visible. In any case, despite those differences the results of these two methods of spatial analysis (HDBSCAN and Gaussian kernel) tend to be similar to each other.
Yet a different method that can be useful to determine the number and location of groups of vents is to adopt a map representation of the modified two-vent azimuth method as described in more detail by Cebriá et al. (2011). Although in this case the separation between vents that is deemed significant needs to be specified beforehand, the results of the groupings outlined by the zones with more lines joining adjacent vents provides an independent estimation of the location and number of possible clusters that is not based on density structure alone. Thus, both methods (density based and line-identification with length limitation) should yield somewhat similar results at small spatial scales, as illustrated in figure 3.
 |
| Figure 3. Comparison of the results obtained when applying a two-point azimuth method with distance limitation and the Gaussian kernel during the study of vent distribution in the Pinacate area, Northwest Mexico (Cañón-Tapia and Jacobo-Bojórquez, 2023). Note the zones of higher vent density marked by the larger concentration of line segments, and also the possible connection between clusters (indicating a probable sub-clustered structure) marked by a few line segments. |
4.2 GEOLOGIC CONSTRAINS
In the rare situation when precise information concerning composition and age of each vent is available, criteria for the identification of spatial patterns might be easy to devise. Alternatively, such abundant information might serve to test the relevance of the results of the various methods of spatial analysis used. Unfortunately, in most situations it is common to lack detailed information about the vents, and most commonly we have to deal with scenarios in which the only information available comes from a satellite image, or a list of coordinates indicating the position of the vents. Fortunately, even in those situations it is possible to include some constraints that might be useful for the interpretation of results. The most important constraint is the distance separating two vents that are likely to be connected at depth by the same conduit. Although the extension of some eruptive fissures can be very large, the separation between adjacent vents along that fissure is commonly less than 5 km (Churikova et al., 2015; Thordarson and Self, 1993; Tibaldi, 1995). Thus, limiting the search of neighboring vents to this distance might be helpful to constrain the location of relevant clusters. In addition, knowing that the orientation of feeder dykes is always perpendicular to the orientation of the minimum horizontal stress (except from very local deviations), but that such local orientation might change systematically with the distance from a central conduit or magma reservoir at depth, might help to separate geologically significant interpretations from other possibilities less unlikely. Another aspect to be considered is that in general larger zones of magma storage are likely to be found deeper than shallow reservoirs, and that larger reservoirs are likely to feed more than one eruption than smaller ones. For that reason, a cluster-subcluster structure might become significant in some occasions. Finally, acknowledging that the shape of reservoirs of magma at depth might evolve with time, and sometimes younger eruptions may take place overlapping zones of older activity might prove to be an important consideration that helps to discriminate the relevant from the not-so relevant vent clusters. A summary of conceptual models is shown in figure 4.
 |
| Figure 4. Summary of conceptual models illustrating the relation of volcano distribution at the surface and subvolcanic components (magma reservoirs, dikes) beneath the surface. a) system in which magma has the same probability to be extracted from every location within the zone of storage, travelling to the surface in conduits that might have a range of inclinations relative to the vertical. The distribution of volcanoes at the surface should be relatively uniform, and the lateral extension of the zone covered by volcanism reflects the lateral extension of the zone of magma storage (ZMS) with some accuracy. b) Similar to a, but with the depth to the main ZMS at a shallower depth, which results in a decreased lateral extension of the system at the surface. c) System with multiple, intermediate depth ZMS. Even if it is assumed that magma has the same probability to be extracted from every location within each of the multiple ZMS, the distribution at the surface is likely to experience some degree of clustering related to the presence of those zones. The lateral extension of the zone of volcanism in this case not longer reflects the dimensions and location of a unique ZMS, but still provides a good approximation to the integrated system defined by those zones. d) Similar to c), but showing the effect of a concentration of activity towards the center of the deepest ZMS , and the construction of a polygenetic volcano. E) Effects of a time gap in a system similar to the one displayed in c. |
4.3 FUZZY CLUSTERING, OVERLAPPING SYSTEMS, OUTLIERS AND SUB-CLUSTER STRUCTURES
The complexity of volcanic phenomena may result in “noisy” data that are difficult to separate in different groups with sharp boundaries. Several methods of clustering analysis have been devised to deal with such situations, including the so-called fuzzy clustering techniques, as well as finite mixture models (Everitt et al., 2011; McLachlan and Peel, 2000). As is the case with the non-fuzzy (aka crisp) partitioning methods, it is necessary to specify the number of expected clusters beforehand, and selection of a different number of clusters result in different cluster partitions. Nevertheless, unlike the crisp-partition counterparts, in fuzzy clustering the partition results are accompanied by information that denotes the grade of membership of each element to each of the identified clusters. In this form, one observation can be interpreted as belonging to two or more groups simultaneously, although with a different level of probability in each case. Ambiguity in the association of each observation with one specific group may be convenient to describe situations in which two or more volcanic systems overlapped spatially, being the result of eruptions fed from different magma reservoirs, or as the result of reactivation of activity in the same general region after a large period of repose after which stress orientations may have changed notably.
One advantage of the fuzzy methods is that they allow us to define a numerical threshold level dividing the clustered observations from those outside a given cluster. Nevertheless, deciding which threshold level should be applied in each particular instance is best left as a subjective decision that ideally should incorporate other sources of information (age, composition, etc.) even if such information is only scarcely distributed among all the observations under examination. Thus, deciding whether a threshold value should be applied to all the clusters in a given region, or it might take different values as a function of geographic position, are examples of decisions that need to be made in a case-by-case basis, and always under the guidance of the local geological features observed in the region of study.
One aspect of the fuzzy methods that may be very useful is the possibility to define somewhat qualitatively observations that can be outliers (isolated vents that do not belong to any particular cluster in the region). Interpretation of such types of vents is always complicated because it is uncertain whether they are extreme events within a dispersed cluster, they represent a first event that could lead to the formation of a different cluster in the region (therefore marking a change in the conditions leading to volcanic activity), or they should be interpreted as isolated eruptions that occurred by mere chance. From an analytical point of view, the outliers influence the location of other clusters in the region, and could lead to biases in the sense that they can be considered by some algorithms to be one group, therefore changing the boundaries and locations of the other groups in the region. Due to their isolated character, this type of observations have very small probabilities of being associated with the other clusters in the region, and therefore can be filtered out from the analysis based on such a probability. Nevertheless, their geologic interpretation or relevance is not always straightforward.
One aspect of the results of fuzzy clustering methods that is not user-friendly concerns the identification of a cluster-subcluster structure. Although all the observations of a subcluster might be characterized by a smaller probability of membership association than the vents in a different subcluster, those differences might be subtle and difficult to detect unless a more complex series of tests is completed. A simpler approach that might be adopted to assess the possibility of such an spatial structure was proposed by Cañón-Tapia (2021b). The procedure is applied to groups of vents that have been identified by any other methods, but that for some reason might seem to be part of a subclustered structure. The assessment is made based on the calculation of the nearest neighbor distances of the observations. From these, a reference distance for each suspected group (called the within cluster distance) is defined by finding the largest nearest neighbor separation for the vents thought to be part of one group. This reference distance is then compared with another reference distance (called the between cluster distance) defined as the shortest nearest neighbor distance found between one vent in one suspected group and one vent in a different suspected group. Then, for each pair of suspected groups the following rule is applied: If the two within cluster distances are smaller than the corresponding between cluster distance, then the two suspected groups can be considered as independent from each other. On the contrary, if one of the within cluster distances is larger than the corresponding between cluster distance, then both groups should be considered to be subclusters of a larger cluster that includes at least those two. Displaying the between and within cluster distances in a triangular matrix therefore facilitates the identification of possible subclusters, and provides a quantitative basis that could be then used as a starting point to make more stringent tests within finite mixture models, if so desired. Nevertheless, the possibility of having subclusters, and their possible geologic implications can be assessed simply from the examination of the mentioned matrix.
- Conclusions
Classification is a human endeavor in which objects sharing common attributes are grouped together, separating them from other objects that do not share those attributes, or that share them only in partial form. Deciding which attributes are important is an entirely subjective matter, and therefore there is no correct or incorrect form to classify a set of objects. Even if attention is restricted to the realm of spatial distribution of volcanic vents there are several subjective decisions that seem unavoidable: Should the groups of vents be defined based in zones of density (larger number of vents/unit area), chemical composition, age, morphology or in a combination of all of the above, and perhaps other parameters? Is it reasonable to enforce a minimum number of vents to define a group, and what should be that number? Is the minimum number of vents that make a cluster the same at a regional scale, or it may change locally? How important is the size (volume) of erupted products? Et cetera.
Other complications that are commonly faced during the study of the spatial distribution of volcanic vents concerns limitations on the number of data, which sometimes blur the connection between the question being asked and the criteria used to organize our dataset. Even worse, those limitations might introduce undetected biases in our organizational efforts.
For those reasons, it is highly recommendable to complete a stage of data exploration at the onset of any study, before any rigid grouping effort is attempted. Unfortunately, as stated by Anscombe (1973), the myth that for any kind of data there is just one set of calculations that constitute a correct set of statistical analyses (myth based on an overly rigid set of mind) often permeates scientific literature. Consequently, the exploratory stage is often suppressed from the published literature, and if completed, it may have been done guided by intricate calculations or in an automatized form, even when those calculations might be inadequate for the particular data set at hand.
Throughout this work it has been shown that there is a large number of methods that can be used to characterize the spatial distribution of volcanic vents; each of these methods may yield different outcomes. Consequently, it has been remarked that 1) it is extremely important to gain conscience about the several assumptions implicit on each method of analysis, 2) never loose sight that not all volcanic systems are equal, and 3) that it is a myth that any quantitative method can provide reliable information about any system.
This work also has shown that a golden rule seems to be the use of more than one method of analysis looking for congruency of results within a range of spatial scales. When this rule is applied, the result is the identification of the most plausible configuration of a system achieved in a robust form. Failure to apply this rule, whether by restricting the analysis to one single method, or by using different methods but always relying in automatized selection of relevant parameters, may lead to the enthronement of false myths or to a number of fallacies that are based on very precise, yet erroneous, preconceptions. In principle, a robust, more accurate model is always preferable to a very precise, yet probably inaccurate one.
Another aspect that has been highlighted in this work is that there are several conceptual models that might need to be assessed in studies of the spatial distribution of vents. Several of those conceptual models imply the formation of a cluster-subcluster structure that is impossible to be encapsulated by using a single method of study, or an automatized selection of parameters. Identification of potential subclusters might guide future efforts to study more details of a particular area with confirmatory purposes. In any case, it should be remarked that the study of the spatial distribution of vents is a fruitful avenue of research when approached with an exploratory perspective. Confirmatory studies are better left to other techniques.
Acknowledgements
This work has been inspired by the numerous comments and questions received over the years either during conversation in scientific meetings or by writing as reviews to submitted papers. In particular, comments by D.A. Schonwalder Angel and K. Nemeth were very helpful to bring this work into focus, and are appreciated. Special thanks are given to A. Camprubí for his encouragement to undertake the writing of this paper.
Contributions of authors
The author of this article declares that he participated in all its elaboration: conceptualization, data analysis, methodological-technical development, writing of the original manuscript, drafting of the corrected and edited manuscript, graphic design, fieldwork, and interpretation.
Financing
This work was funded by CONACYT grant A1-S-23107.
Conflicts of interest
The author declares that there is not competing interests, financial or otherwise, that could have influenced the reported research.
References
Anscombe, F. J., 1973, Graphs in statistical analysis: The American Statistician, 27, 17-21.
Bleacher, J.E., Glaze, L.S., Greeley, R., Hauber, E., Baloga, S.M., Sakimoto, S.E.H., Williams, D.A., Glotch, T.D., 2009, Spatial and alignment analyses for a field of small volcanic vents south of Pavonis Mons and implications for the Tharsis province: Mars. Journal of Volcanology and Geothermal Research, 185(1-2), 96-102. https://doi.org/10.1016/j.jvolgeores.2009.04.008
Cañón-Tapia, E., 2016, Reappraisal of the significance of volcanic fields: Journal of Volcanology and Geothermal Research, 310, 26-38. https://doi.org/10.1016/j.jvolgeores.2015.11.010
Cañón-Tapia, E., 2020, Influence of method selection on clustering analyses of point-like features: Examples from three zones of distributed volcanism: Geomorphology, 354, 107063. https://doi.org/10.1016/j.geomorph.2020.107063
Cañón-Tapia, E., 2021a, Vent distribution and sub-volcanic systems: Myths, fallacies, and some plausible facts: Earth-Science Reviews, 221, 103768. https://doi.org/10.1016/j.earscirev.2021.103768
Cañón-Tapia, E., 2021b, Vent distribution on Jeju Island, South Korea: Glimpses into the subvolcanic system: Journal of Geophysical Research: Solid Earth, 126(9), e2021JB022269. https://doi.org/10.1029/2021JB022269
Cañón-Tapia, E., 2022, Kernel Analyses of Volcanic vent distribution: How accurate and complete are the objective Bandwidth Selectors?: Frontiers in Earth Science, 10, 779095. https://doi.org/10.3389/feart.2022.779095
Cañón-Tapia, E., Jacobo-Bojórquez, R.A.,2023, El Pinacate volcanic field, Northwest Mexico: An example of a shield cluster: Boletín de la Sociedad Geológica Mexicana, 75 (2), A020523. http://dx.doi.org/10.18268/BSGM2023v75n2a020523
Cebriá, J.M., Martín-Escorza, C., López-Ruiz, J., Morán-Zenteno, D.J., Martiny, B.M., 2011. Numerical recognition of alignments in monogenetic volcanic areas: Examples from the Michoacán-Guanajuato volcanic filed in Mexico and Caltrava in Spain; Journal of Volcanology and Geothermal Research, 201(1-4), 73-82. https://doi.org/10.1016/j.jvolgeores.2010.07.016
Churikova, T.G., Gordeychik, B.N., Edwards, B.R., Ponomareva, V.V., Zelenin, E.A., 2015, The Tolbachik volcanic massif: A review of the petrology, volcanology and eruption history prior to the 2012–2013 eruption: Journal of Volcanology and Geothermal Research, 307, 3-21. https://doi.org/10.1016/j.jvolgeores.2015.10.016
Connor, C.B., 1990, Cinder cone clustering in the transmexican volcanic belt: implications for structural and petrologic models: Journal of Geophysical Research: Solid Earth, 95(B12), 19395-19405. https://doi.org/10.1029/JB095iB12p19395
Connor, C.B., Hill, B.E., 1995, Three nonhomogeneous Poisson models for the probability of basaltic volcanism: application to the Yucca Mountain region: Journal of Geophysical Research: Solid Earth, 100(B6), 10107-10125. https://doi.org/10.1029/95JB01055
Connor, C.B., Condit, C.D., Crumpler, L.S., Aubele, J.C., 1992, Evidence of regional structural controls on vent distribution: Springerville Volcanic Field, Arizona.: Journal of Geophysical Research: Solid Earth, 97(B9), 12349-12359 https://doi.org/10.1029/92JB00929
Connor, C.B., 1987, Structure of the Michoacán-Guanajuato volcanic field, Mexico: Journal of Volcanology and Geothermal Research, 33(1-3), 191-200. https://doi.org/10.1016/0377-0273(87)90061-8
Connor, C.B., Connor, L.J., Germa, A., Richardson, J.A., Bebbington, M., Gallant, E., Saballos, J.A., 2019, How to use kernel density estimation as a diagnostic and forecasting tool for distributed volcanic vents: Statistics in Volcanology, 4, 1-25. http://dx.doi.org/10.5038/2163-338X.4.3
Estivill-Castro, V., 2002, Why so many clustering algorithms: A position paper: ACM SIGKDD Explorations Newsletter, 4(1), 65-75. https://doi.org/10.1145/568574.568575
Everitt, B.S., Landau, S., Leese, M., Stahl, D., 2011, Cluster Analysis: Chichester, John Wiley & Sons, 330 p.
Fahad, A., Alshatri, N., Tari, Z., Alamri, A., Khalil, I., Zomaya, A.Y., Foufou, S., Bouras, A., 2014, A survey of clustering algorithms for big data: taxonomy and empirical analysis: IEEE Transactions on Emerging Topics in Computing, 2(3), 267-279. https://doi. 10.1109/TETC.2014.2330519
Jain, A., Dubes, R., 1988, Algorithms for clustering data: Englewood Cliffs NJ, Prentice Hall, 320 p.
Jones, M.C., Marron, J.S., Sheather, S.J., 1996a, A Brief Survey of Bandwidth Selection for Density Estimation: Journal of the American Statistical Association, 91(433), 401-407.
Jones, M.C., Marron, J.S., Sheather, S.J., 1996b. Progress in data-based bandwidth selection for Kernel density estimation: Computational Statistics, 11, 337-381.
Kircher, A., 1678, Mundus subterraneus (Fragment) in Mather, K. F.S., Mason, L. (eds.), A source book in Geology: Cambridge, Massachussets, Harvard University Press, 17-19.
Kiyosugi, K., Connor, C.B., Wetmore, P.H., Ferwerda, B.P., Germa, A.M., Connor, L.J., Hintz, A.R., 2012, Relationship between dike and volcanic conduit distribution in a highly eroded monogenetic volcanic field: San Rafael, Utah, USA: Geology, 40(8), 695-698. https://doi.org/10.1130/G33074.1
Kiyosugi, K., Connor, C.B., Zhao, D., Connor, L.J., Tanaka, K., 2009, Relationships between volcano distribution, crustal structure, and P-wave tomography: an example from the Abu Monogenetic Volcano Group, SW Japan: Bulletin of Volcanology, 72, 331-340. https://doi.org/10.1007/s00445-009-0316-4
Lutz, T.M., Gutmann, J.T., 1995, An improved method for determining and characterizing alignements of point like features and its implications for the Pinacate volcanic field, Sonora, Mexico: Journal of Geophysical Research: Solid Earth, 100(B9),17659-17670. https://doi.org/10.1029/95JB01058
Lutz, T.M., 1986, An analysis of the orientations of large scale crustal structures: a statistical approach based on aerial distributions of point like features: Journal of Geophysical Research: Solid Earth, 91(B1), 421-434. https://doi.org/10.1029/JB091iB01p00421
Magill, C.R., McAneney, K.,J., Smith, I.E.M., 2005, Probabilistic assessment of vent locations for the next Auckland volcanic field event: Mathematical Geology, 37, 227-242. https://doi.org/10.1007/s11004-005-1556-2
Martí, J., Groppelli, G, Brum da Silveira, A., 2018, Volcanic stratigraphy: A review: Journal of Volcanology and Geothermal Research, 357, 68-91, https://doi.org/10.1016/j.jvolgeores.2018.04.006
Martin, A.J., Umeda, K., Yusa, Y., 2003, Probabilistic approaches for predicting the long‐term spatial and temporal characteristics of monogenetic volcanoes; Application to two monogenetic volcano fields in Japan: Saikuru Kiko Giho, 18, 59-70.
McLachlan, G.J., Peel, D., 2000, Finite mixture models: USA, John Wiley & Sons, Inc, 419 p.
Minnotte, M.C., 1997, Nonparametric testing of the existence of modes: The Annals of Statistics, 25,1646-1660.
Németh, K., Palmer, J., 2019, Geological mapping of volcanic terrains: Discussion on concepts, facies models, scales, and resolutions from New Zealand perspective: Journal of Volcanology and Geothermal Research, 385, 27-45. https://doi.org/10.1016/j.jvolgeores.2018.11.028
Oldroy, D., 1996, Thinking about the Earth: A history of ideas in Geology: Cambridge, Massachusetts, Harvard University Press, 410 p.
Rosenblatt, M., 1956, Remarks on some nonparametric estimates of a density function: Annals of Mathematical Statistics, 27(3), 832-837. https://doi.org/10.1214/aoms/1177728190
Silverman, B.W., 1986, Density estimation for statistics and data analysis: New York, Chapman and Hall, 175 p.
Sohn, Y.K., Park, K.H., 2005, Composite tuff ring/cone complexes in Jeju Island, Korea: possible consequences of substrate collapse and vent migration: Journal of Volcanology and Geothermal Research, 141(1-2), 157-175. https://doi.org/10.1016/j.jvolgeores.2004.10.003
Song, J.H., Kim, S., Rhie, J., Lee, S.H., Kim, Y.H., Kang, T.S., 2018, Imaging of Lithospheric Structure Beneath Jeju Volcanic Island by Teleseismic Traveltime Tomography: Journal of Geophysical Research: Solid Earth, 123(3), 6784-6801. https://doi.org/10.1029/2018JB015979
Thordarson, T., Self, S., 1993, The Laki (Skaftár Fires) and Grímsvötn eruptions in 1783-1785: Bulletin of Volcanology, 55, 233-263. https://doi.org/10.1007/BF00624353
Tibaldi, A., 1995, Morphology of pyroclastic cones and tectonics: Journal of Geophysical Research: Solid Earth, 100(B12), 24521-24535. https://doi.org/10.1029/95JB02250
Wadge, G., Cross, A., 1988, Quantitative methods for detecting aligned points: an application to the volcanic vents of the Michoacán Guanajuato volcanic field, Mexico: Geology, 16(9), 815-818. https://doi.org/10.1130/0091-7613(1988)016<0815:QMFDAP>2.3.CO;2
Weller, J.N., Martin, A.J., Connor, C.B., Connor, L.J., Karakhanian, A., 2006, Modelling the spatial distribution of volcanoes: an example from Armenia, in Mader, H., Coles, M.S., Connor, G.C., Connor, L. J. (eds.), Statistics in volcanology: London, Geological Society, 77-87.
Wierzchon, S.T., Klopotec, M.A., 2018, Modern algorithms of cluster analysis: Switzerland, Springer International Publishing, Cham, 421 p.
Peer Reviewing under the responsibility of Universidad Nacional Autónoma de México.
This is an open access article under the CC BY-NC-SA license(https://creativecommons.org/licenses/by-nc-sa/4.0/)