|
Boletín de la Sociedad Geológica Mexicana Volumen 74, núm. 1, A071021, 2022 http://dx.doi.org/10.18268/BSGM2022v74n1a071021
|
 |
Assessment of vulnerability to water shortage in the municipalities of Mexico City
Evaluación de la vulnerabilidad a la escasez de agua en las alcaldías de la Ciudad de México
Alma R. Huerta-Vergara1,*, Saúl Arciniega-Esparza2, Adrián Pedrozo-Acuña3, Arnoldo Matus-Kramer4, Eduardo Vega-López5
1 Posgrado en Ciencias de la Sostenibilidad, Universidad Nacional Autónoma de México. Circuito Escolar S/N, Coyoacán, CDMX, 04510, Mexico.
2 Facultad de Ingeniería, Universidad Nacional Autónoma de México. Circuito Escolar S/N, Coyoacán, CDMX, 04510, Mexico.
3 Instituto Mexicano de Tecnología del Agua. Blvd. Paseo Cuauhnáhuac 8532, Progreso, 62550 Jiutepec, Morelos, Mexico.
4 ITHACA Environmental, Av. Mazatlán 5, Condesa, Cuauhtémoc, CDMX, 06140, Mexico.
5 Facultad de Economía, Universidad Nacional Autónoma de México. Circuito Escolar S/N, Coyoacán, CDMX, 04510, Mexico.
* Corresponding author: (A. Huerta) This email address is being protected from spambots. You need JavaScript enabled to view it.
How to cite this article:
Huerta-Vergara, A. R., Arciniega-Esparza, S., Pedrozo-Acuña, A., Matus-Kramer, A., Vega-López, E., 2022, Assessment of vulnerability to water shortage in the municipalities of Mexico City: Boletín de la Sociedad Geológica Mexicana, 74 (1), A071021. http://dx.doi.org/10.18268/BSGM2022v74n1a071021
ABSTRACT
Water issues in Mexico City have been severe during the last years due to population increase, forcing external water sources to meet water demands. This research aims to evaluate the evolution of water vulnerability in the sixteen municipalities of Mexico City in the years 2005, 2010, and 2015. This vulnerability has increased in the last decades due to the combination of several problems such as lack of maintenance in the water infrastructure (eg. water leaks), aquifer overexploitation, uncontrolled city growth, rainwater and wastewater expelled from the basin without the intention of using it. For the vulnerability assessment we used a combination of indicators that respond to its three dimensions: 1). Exposure (urbanization, population, and economic units), 2). Sensitivity (reports of leaks, shortages, and poor water quality) and 3). Adaptive capacity (wastewater treatment, water availability, and GDP). The municipalities identified with very high vulnerability in the three years of study (2005, 2010, and 2015) were Iztapalapa, Gustavo A. Madero, and Tlalpan joined these during 2015. In contrast, those with the lowest vulnerability were Milpa Alta, Magdalena Contreras, and Cuajimalpa; the latter stepped down from having Low to Very Low vulnerability between 2005 and 2010-2015. Between these two classifications, we have the Municipalities that reveal high, moderate, and low vulnerability. The results highlight that all municipalities must prevent water leaks to achieve increasingly sustainable management of the liquid, especially Gustavo A. Madero, Iztapalapa, and Tlalpan. Suggesting that harmonized action among all of them will help accelerate goal achievement. Still, citizen action will play a leading role in maintaining care and water usage levels when promoted and encouraged adequately. At the end of the lecture, the reader would be able to discuss if a series of social elements (like the indicators proposed in this work) construct water vulnerability or depend on the quantity of water the cities receive. Also, they will understand their role in water management and have factors to evaluate vulnerability in other regions.
Keywords: water vulnerability, water supply, exposure, adaptive capacity, urbanization, Mexico City.
RESUMEN
Los problemas del agua en la Ciudad de México se han agravado durante los últimos años debido al aumento de la población, lo que obligó a recurrir a fuentes de abastecimiento de agua externas para satisfacer la demanda. Este trabajo tiene como objetivo evaluar la evolución de la vulnerabilidad hídrica en los dieciséis municipios de la Ciudad de México en los años 2005, 2010 y 2015. Esta vulnerabilidad se ha incrementado en las últimas décadas debido a la combinación de varios problemas como la falta de mantenimiento en la infraestructura del agua (por ejemplo, fugas de agua), sobreexplotación del acuífero, crecimiento descontrolado de la ciudad, las aguas de lluvia y residuales son expulsadas de la cuenca sin la intención de utilizarlas. La evaluación de la vulnerabilidad siguió una metodología que la evalúa ante eventos de sequía, utilizando una combinación de indicadores que responden a sus tres dimensiones: 1). Exposición (urbanización, población y unidades económicas), 2). Sensibilidad (reportes de fugas, escasez y mala calidad del agua) y 3). Capacidad de adaptación (tratamiento de aguas residuales, disponibilidad de agua y PIB).Los municipios identificados con vulnerabilidad muy alta en los tres años de estudio (2005, 2010 y 2015) fueron Iztapalapa, Gustavo A. Madero y Tlalpan se une a estas dos durante el 2015. En contraste, los de menor vulnerabilidad fueron Milpa Alta, Magdalena Contreras y Cuajimalpa; este último pasó de tener una vulnerabilidad baja a muy baja entre 2005 y 2010-2015. Entre estas dos clasificaciones, tenemos los municipios que revelan vulnerabilidad Alta, Moderada y Baja. Los resultados destacan que todos los municipios deben prevenir fugas de agua para lograr un manejo cada vez más sostenible del líquido, especialmente Gustavo A. Madero, Iztapalapa y Tlalpan. Sugerir que la acción armonizada entre todos ayudará a acelerar el logro de las metas. Aún así, la acción ciudadana jugará un papel de liderazgo en el mantenimiento de los niveles de cuidado y uso del agua cuando se promueva y aliente adecuadamente. Al final de la lectura, el lector será capaz de discutir si una serie de elementos sociales (como los indicadores que se proponen en este trabajo) construyen vulnerabilidad hídrica o depende de la cantidad de agua que reciben las ciudades. Además, comprenderán su papel en la gestión del agua y tendrán factores para evaluar la vulnerabilidad en otras regiones.
Palabras clave: vulnerabilidad hídrica, abastecimiento de agua, exposición, sensibilidad, capacidad de adaptación, urbanización, Ciudad de México.
- Introduction
In the last decades, there has been an increase in water demand worldwide, especially in arid and semi-arid regions (see Hamouda et al., 2009). Due to this, many countries focus on strategies to face water deficit and satisfy as their population grows and their economies develop (Chenoweth, 2008). Even countries with a vast wealth of water resources have faced conflicts due to social, economic, legal, and political factors, as in the U.S. (Padowski and Jawitz, 2012) and Costa Rica (Esquivel et al., 2018).
Mexico City is a clear example of the water vulnerability faced by the world, shown through the scarcity of water induced by the concentration and demographic increase in urban areas (e.g., Mexico City went from 8 235 7484 in 1990 to 8 918 653 in 2015 (INEGI, 2015; González, 2018). Other factors are the inadequate use of natural resources in general and unequal access to water resources in particular (Jiménez et al., 2011; Velasco et al., 2014). Population distribution and growth in Mexico City occur unevenly and without planning (Instituto Nacional para el Federalismo y el Desarrollo Municipal, 2017), resulting in a decrease in the rural population and a significant increase in the urban population (e.g., in 2010, a total of 239 125 persons from other entities moved to Mexico City; The Rockefeller Foundation and Arup, 2014). This situation has led to disjointed urban growth (BID, 2012; Sheinbaum, 2008) with an increase in random economic activities with a lack of planning, which in appearance could lead to a rise in the quality of life standards of city migrants (The Rockefeller Foundation and Arup, 2014). Still, instead, they face a significant consequence, the increase in the demand for water resources.
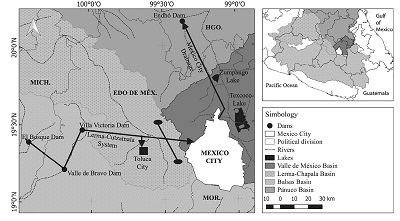
Currently, Mexico City is not self-sufficient in its water supply. It increasingly depends on external sources. And despite bringing water from distant sources (Figure 1), more than 38% of the water extracted from basins and aquifers is lost in leaks and clandestine intakes (Perló Cohen and González Reynoso, 2005; Sistema de Aguas de la Ciudad de México, 2012). The conservation, expansion and modernization of the existing infrastructure and the development of new projects are “solutions” that have brought high social, environmental and economic costs (Fondo para la Comunicación y la Educación Ambiental et al., 2006) and have also turned out to be transitory (CONAGUA, 2012a,2012b; Gobierno de la Ciudad de México, 2013).
 |
|
Figure 1. Main external sources of water supply to Mexico City. Arrows indicate water inlet and outlet. |
Given the limited number of sustainable proposals for water management in Mexico City, it is necessary to highlight the importance of understanding and measuring vulnerability to a problem of liquid shortage (Sena et al., 2012). In fact, the concept of
water vulnerability is often used in climate change literature (Romero Lankao and Qin, 2011; Ford et al., 2018), especially in drought events.
The issues that require sustainable initiatives and the indicators used to measure vulnerability are many (Cutter, 1996). However, there are no proposals involving Mexico City inhabitants to solve these problems, so working with them can no longer be delayed. In seeking to bring society closer to the water problem in Mexico City, we decided to follow a social vulnerability approach to water stress. Understood as the exposure of groups resulting from social and environmental changes, where stress refers to unexpected changes and interruptions in ways of life (Adger, 1999; Adger and Kelly, 1999).
As background for this study, we considered highly accepted data, like that 20% of the world population, and Mexico City is no exception, lacks regular access to clean water for domestic use, and 50% lacks adequate liquid for hygiene and/or sanitation (Sena et al., 2012). In Mexico City, as in another megalopolis, this is reflected in the shortage of drinking water, lack of sanitation and exposure to diseases transmitted through water, and risks in population groups forced to reside in areas exposed to high water pollution levels (Sena et al., 2012).
Few studies in Mexico City reveal the water situation of each Municipality based on the combination of key indicators (Jiménez et al., 2011; Velasco, 2014). Most of the reports found are based only on the availability and water endowment. Unfortunately, water in Mexico City is underappreciated and taken for granted. However, water awareness and conservation are still deficient, so generating data to exemplify correct situations is particularly important.
In the following paragraphs, we will analyze the existing vulnerability in Mexico City’s municipalities based on some physical and biological characteristics (here referred to as indexes), together with the exposure degree of the population that resides there (Cutter, 1996; Sena et al., 2012). Water scarcity vulnerability in Mexico City studies the dynamic process of exposure, sensitivity, and adaptive capacity of a group of individuals (Cutter, 1996; Adger, 2006; Hamouda et al., 2009) who live in the municipalities of Mexico City (Cutter, 1996). Based on the above, this research aims to evaluate the evolution of water vulnerability in the sixteen municipalities of Mexico City using social, environmental, and economic conditions indicators in the years 2005, 2010, and 2015. This contribution will allow the proposal of areas with a need for action to improve water management in the municipalities of Mexico City.
- Background
Mexico City was part of the landscape of the Valley of Mexico, which was made up of five lakes: Zumpango and Xaltocan to the north; Texcoco to the center; Xochimilco and Chalco to the south, which during the rainy season formed only one (Ezcurra, 1996). However, the civilizations that developed from the Mexicas to the Viceregal City were affected by rising water levels, which caused floods, and consequently, damage to the population and the city (Perló and González, 2006). For this reason, authorities implemented “solutions” to mitigate these events. In the early seventeenth century, efforts began with constructing a tunnel that drained the waters of the rivers that caused the flooding of the lakes of the Valley of Mexico. Two centuries later, under the government of Porfirio Díaz, the Gran Canal del Desagüe was built, and in 1947 a third artificial outlet was completed. Later in 1975, the Deep Drainage was inaugurated, giving rise to a fourth water outlet from the City (Jiménez et al., 2011). These four systems are responsible for expelling sewage into Endhó Dam in the Tula River basin (Figure 2). When they exceeded their capacity in 2008, a second deep drainage system began, with the East Emitting Tunnel.
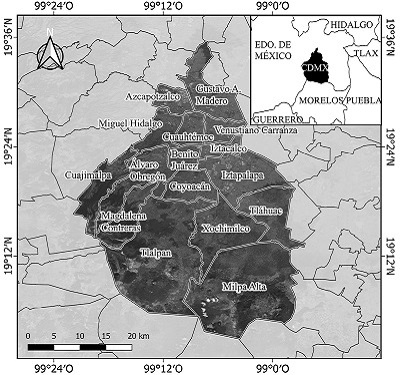 |
| Figure 2. Location of Municipalities in Mexico City. |
The historical floods in Mexico City made it difficult to think that it would suffer a scarcity problem in the second half of the 20th century (Gobierno de la Ciudad de México, 2013). This paradox is mainly the result of actions throughout history to solve the problems caused by floods dissociated from supply systems. That is, to expel the water out of the basin without any concern or intention of recovering it (Perló and González, 2005).
- Materials and methods
Study area and its problems. – Mexico City is located at an altitude of 2,240 meters above sea level (masl) and is divided into 16 municipalities (Figure 2), covering a land area of 1,495 km2 (Velasco et al., 2014; Figure 2).
Mexico City is supplied with water through a complex structure that manages external and internal sources (Figure 2). Each source is operated by the Organismo de Cuenca Región XIII, Aguas del Valle de México (OCAVM) (Region XIII Basin Agency, Aguas del Valle de México (OCAVM)) or by the Sistema de Aguas de la Ciudad de México (SACMEX) (Water System of Mexico City (SACMEX)). The latter is in charge of operating the water supply to the entire city (Escolero et al., 2016).
The city´s main water internal supply sources are the aquifers Zona Metropolitana Ciudad de México, Texcoco, and Chalco-Amecameca, and according to Mazari et al., (2006) groundwater is seriously threatened by organic components and geological characteristics. The Cutzamala and Lerma Systems (Figure 2), the Plan de Acción Inmediata (PAI), and the Chiconautla System correspond to external sources. They were implemented to alleviate some of the consequences of the intensive exploitation of the internal aquifers that supply Mexico City (BID, 2012). Among the most important problems due to intensive exploitation is land subsidence (Solano et al., 2015), which has caused damage to buildings, and water and drainage networks (Secretaría de Gobernación and Centro Nacional de Prevención de Desastres, 2001).
There are quantitative and semi-quantitative methods to measure vulnerability (Adger, 1999; Brooks et al., 2005; Eakin and Luers, 2006; Hamouda et al., 2009; Sena et al., 2012; Escolero et al., 2016; Ortega et al., 2016). We followed Ortega et al. (2016; Figure 3; Appendix A-E) because their methodology (that evaluates vulnerability to drought events) is clear and practical. From this, we decided to follow the social vulnerability approach to water stress. Every step is consistent and can be replicated anywhere in the world regardless of scale. The key is to have measurable indicators grouped in the three dimensions of vulnerability. Every indicator responds positively or negatively to vulnerability and the mixture of these results in a well-defined vulnerability index.
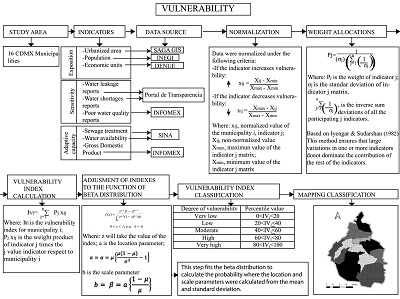 |
| Figure 3. Methodology. Modified from Ortega Gaucín et al. (2016). |
The methodology uses a weighting method based on the proposal of Iyengar and Sudarshan (1982), which allows evaluating vulnerability through indicators that can be quantified using standardized methods (Figure 3). This procedure facilitates obtaining a vulnerability classification (Very Low, Low, Medium, High, and Very High) for each of the 16 municipalities in Mexico City. It compares the category obtained with water endowment and the rainwater harvesting systems of each Municipality.
We followed the next steps:
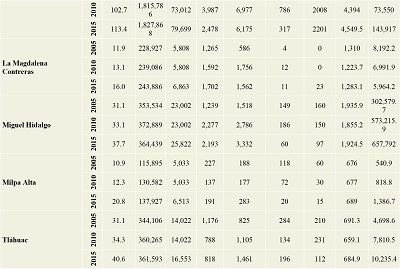
- a) The selection of indicators was made from the bibliographic review regarding the subject and the availability and/or access to the data (Adger and Kelly, 1999; Adger et al., 2004; Brooks et al., 2005; Hamouda et al., 2009). We grouped the chosen indicators into the three vulnerability components (exposure, sensitivity, and adaptive capacity). In the case of exposure, we used the indicators of urbanization, the number of inhabitants, and economic units. For sensitivity, there are reports of water leaks, water shortages, and poor water quality. And for adaptive capacity, we used data on wastewater treatment, water availability, and Gross Domestic Product (GDP) (Table 1).
- b) Collection and generation of data. Appendix A summarizes the methodology to obtain data for the indicators used in this study. We highlight that we developed the methodologies to calculate the urbanization indicator and water availability to incorporate the data into the methodology of Ortega et al. (2016).
- c) Application of Ortega et al. (2016) methodology. Figure 3 resumes this methodology, and in Appendixes B, C, D, and E are normalizations, weight allocation, vulnerability index calculation, and vulnerability index classification results.
- d) Comparison of vulnerability indexes with water endowment and rainwater harvesting systems. - For this comparison, we obtained data following the methodology in Appendix F.
4.Results
Based on the indicators of exposure, sensitivity, and adaptive capacity (Figure 3), the municipalities identified as the ones with the greatest vulnerability in the three years of study (2005, 2010, and 2015) were Iztapalapa and Gustavo A. Madero, but by 2015 Tlalpan joined these two (Figure 4). In contrast, those with the least vulnerability were Milpa Alta, Magdalena Contreras and Cuajimalpa (Figure 4). This last one step from having Low to Very Low vulnerability between 2005 and 2010-2015. In the High vulnerability classification were Álvaro Obregón, Coyoacán, and Xochimilco. This last one stepped up from having Moderate to High vulnerability in 2015 (Figure 4). In the Moderate vulnerability classification were Azcapotzalco, Cuauhtémoc, Miguel Hidalgo, Venustiano Carranza and Tláhuac (Figure 4). Low vulnerability classification characterized the municipalities Iztacalco and Benito Juárez (Figure 4).
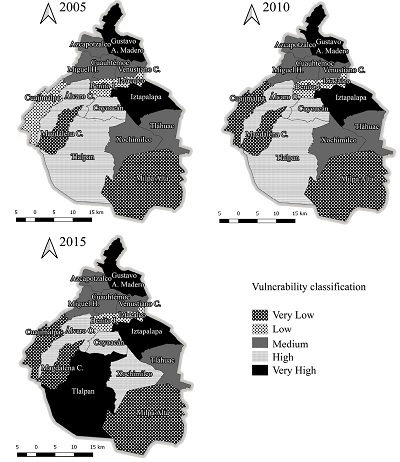 |
| Figure 4. Vulnerability classification (from very low to very high vulnerability). |
In Mexico City, there is a close relationship between vulnerability indexes (Appendix C) and urban growth (Table 1). Municipalities such as Iztapalapa, Gustavo A. Madero, and Tlalpan have very high water vulnerability and have the highest urban growth (Figure 5). The latter changed its vulnerability level from High to Very High between 2010 and 2015. In contrast, in the municipalities with the lowest rate of urban growth, Magdalena Contreras, Cuajimalpa, and Milpa Alta, water vulnerability tended to be Very Low, highlighting Cuajimalpa, which went from Low to Very Low from 2010 to 2015.
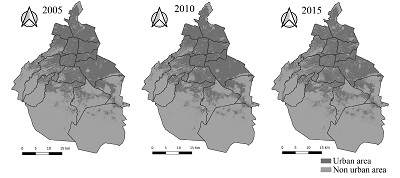 |
| Figure 5. Mexico City urbanization. |
Population size is another key indicator similar to urbanization in Iztapalapa, Gustavo A. Madero, and Álvaro Obregón, which have the largest population, even though Álvaro Obregón is not one of the most urbanized municipalities. The first two presented a Very High vulnerability index and Álvaro Obregón High. In contrast, those with the least population, Milpa Alta, Cuajimalpa, and Magdalena Contreras, obtained a Very Low vulnerability index for the first and third cases and a Low-Very Low level in Cuajimalpa.
We found the highest concentration of economic units in the Iztapalapa, Cuauhtémoc, and Gustavo A. Madero municipalities, highlighting their vulnerability. For the first and third municipalities, the vulnerability was Very High and, for the second one, it was Moderate. The municipalities of Milpa Alta, Magdalena Contreras, and Cuajimalpa once again stood out for having a lower concentration of economic units and a Very Low vulnerability index for the first two cases and Low to Very Low for the third case.
The control of leaks as an adaptation measure requires the joint action of Mexico City’s municipalities. The data suggested focusing immediately on Coyoacán, Tlalpan, and Iztapalapa municipalities, which had the highest number of leaks. The municipalities of Milpa Alta, Cuajimalpa, and Venustiano Carranza can be excellent examples of what leakage control means. In addition to leading this index positively, they represent municipalities with water infrastructure that varies from limited (M.A.) to moderate (V.C. and C), but which provides adequate service since Milpa Alta and Cuajimalpa, in addition to Tláhuac, are representatives of municipalities with fewer shortage reports. These indexes warn about the need to carry out immediate actions that promote the good use of the water infrastructure in areas such as Gustavo A. Madero, Iztapalapa, Tlalpan (Very High), Álvaro Obregón, Coyoacán, and Xochimilco (High) that stood out for their excessive vulnerability. Recommended actions should be like those conducted in Milpa Alta, Cuajimalpa, and Tláhuac.
Coyoacán is an example of concern because, although this Municipality is the one that draws the most water from the aquifer (Comisión Nacional del Agua, 2015c), it had the highest number of leak reports for the annual period between 2000 and 2018 (Portal de Transparencia). This deficient use of water by the Municipality is supported by its High vulnerability as found during the analysis of the investigated period, suggesting that actions to mitigate the problem have been insufficient and require greater, better-supported initiatives. The municipalities of Xochimilco, Tlalpan, and Iztapalapa saw through these indicators suggested similar issues. Unfortunately, those that extract the most significant amount of water from the aquifer (Coyoacán, Tlalpan, Xochimilco) (Comisión Nacional del Agua, 2015a, 2015b, 2015c) have severe problems with the control of leaks (Table 1). Indeed for the same reason, the three municipalities are rated with very high vulnerability. In the case of Tlalpan, it went from High to Very High vulnerability in 2015; Coyoacán maintained its vulnerability High, and in Xochimilco, vulnerability went from Moderate to High in 2015. In contrast, the municipalities that extract less liquid from the aquifer, such as Cuajimalpa, Venustiano Carranza and Gustavo A, Madero (Comisión Nacional del Agua 2015a, 2015b, 2015c), tended to have fewer water leaks, at least in the cases of Cuajimalpa and Venustiano Carranza. Consequently, their vulnerability classification varied from Very Low in Cuajimalpa to Moderate in Venustiano Carranza.
The water shortages reports show that the municipalities with the highest index in this area were Iztapalapa, Benito Juárez, and Cuauhtémoc. In the first case, the Very High vulnerability was consistent with the shortage reports. In contrast to the previous point, Benito Juárez and Cuauhtémoc, with Low and Medium vulnerability respectively, suggested that their significant number of water shortages reports must be carefully analyzed to understand these contrasting situations.
As implemented in this work, the water quality index generated a worrying panorama in which no system allows improving monitoring water quality in Mexico City. Tlalpan was a clear example of concern regarding the upward trend in poor quality reports throughout the study period. Similarly, the constancy of Iztapalapa throughout the study period as the Municipality with the highest number of poor water quality reports is a problem that must be dealt immediately. Xochimilco had a problem similar to Iztapalapa due to its persistence in the second level of reports on poor water quality in the last two study periods. In contrast to these situations that threaten health and hygiene, Cuajimalpa went from experiencing a truly deplorable condition in 2005 to being one of the municipalities with the fewest poor water quality reports in the last two study periods. Magdalena Contreras stood out in this area for being constant during the three five-year study periods in terms of the lowest number of reports regarding water quality. Other municipalities such as Milpa Alta, Benito Juárez, and Cuauhtémoc tended to have fewer bad reports. Still, they couldn’t maintain the lowest level of reports, so they should redouble efforts to improve their service.
Water availability is considered one of the most relevant indexes in hydric matters; however, as mentioned in previous paragraphs, it is not the only one that influences the vulnerability analyses. We observed that the municipalities with the most significant water availability were Iztapalapa, Tlalpan, and Gustavo A. Madero, but at the same time, they concentrated high population numbers. Surprisingly, these were the municipalities with the highest vulnerability index. In contrast, those with the least water availability were Cuajimalpa, Tláhuac, and Iztacalco, with Very Low, Medium, and Low vulnerability indexes, respectively. Of course, water availability is not the only element that makes a Municipality vulnerable or not. It is the combination of different factors that will define its vulnerability degree. Therefore, the joint analysis of the data will surely provide opportunities for promoting water sustainability in the municipalities and Mexico City.
Water recovery is undoubtedly another aspect that must not be delayed, though it has been overlooked in Mexico City. The reduction and control of water leaks should also be regarded as crucial to getting closer to having a functional sustainable system in Mexico City (Mazari and Noyola, 2019). During the three years of the study, we discovered that only between 10% and 11% of the water used in the city is treated. Iztapalapa is the Municipality that treats the most water with a percentage of between 46 and 48%. This Municipality is an excellent example of adaptation to wastewater treatment, which contributes perfectly to cleaning bathrooms and watering green areas, significantly reducing drinking water use for these purposes. Unfortunately, Iztapalapa presented a Very High vulnerability index as a result of this study, so it is essential to take other actions that help mitigate this problem. At the same time, municipalities such as Benito Juárez, Cuajimalpa, and Venustiano Carranza did not treat water during the study period (Table 1). But hard, low, very low, and moderate vulnerability, respectively, can serve as examples of the actions to be developed in Iztapalapa to reduce its vulnerability.
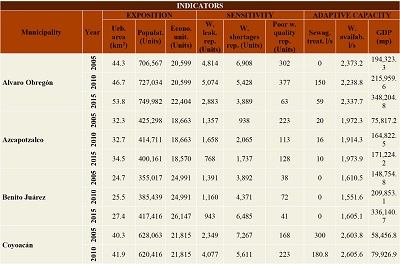
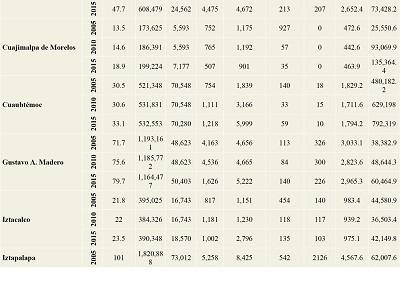
| Table 1. Indicators used. |
 |
 |
 |
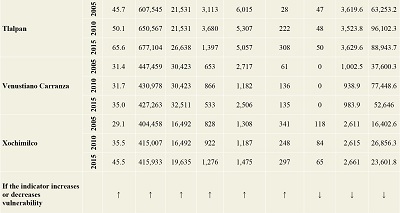 |
| Note: Urb. Area: Urbanized area (square kilometers); Populat.: Population (units); Econo. unit. (units): Economic units (units); W. leak rep. (units): Water leak reports (units); W. shortages rep.: Water shortages reports (units); Poor w. quality rep.: Poor water quality reports (units); Sewag. trea.: Sewage treatment (liters per second); W. availab. Water availability (liters per second); GDP: Gross Domestic Product (million pesos). |
A fundamental aspect of advancing toward a sustainable water proposal is to have the necessary financing to study the vulnerability problem and fund projects seeking sustainable solutions. Although there is no concrete data on how each Municipality finances the care and better use of water, GDP can be used as a proxy that allows an approach, possibly weak and in need of reassessment, to the state of the financing/vulnerability relationship. No less important is having resources to assess the progress of programs being implemented for specific purposes. Well-analyzed assessments will always generate improvements to the initial proposal. Considering that this index must be refined to achieve better-supported results, several aspects justify its inclusion here. The municipalities with the highest GDP, Cuauhtémoc, Miguel Hidalgo, Álvaro Obregón, and Benito Juárez, fund actions to mitigate water issues, but unfortunately, this support has not helped to change Very High vulnerability levels. It is vital to focus efforts to understand why they do not reach the desired Low or Very Low levels and highlight the need to look at other indexes that provide answers to improve their approach to sustainable water management. Only Benito Juárez reached Low levels of vulnerability, while in Álvaro Obregón, this was High, and in the first two municipalities, their level was Moderate. In contrast, the municipalities with the lowest GDP tended to be less vulnerable, without achieving it at all. Although Milpa Alta and Magdalena Contreras had Very Low vulnerability, in Tláhuac, it was Moderate, and surprisingly Xochimilco was classified as Moderate to High vulnerability.
Water endowment in all municipalities is unevenly distributed, bearing in mind that it should be 100 liters/inhabitant/day according to the WHO (Table 2). The details between the water endowment and the level of vulnerability can be seen in Table 2.
| Table 2.Comparison between vulnerability and water supply (Liters per citizen per day (LPCD)). |
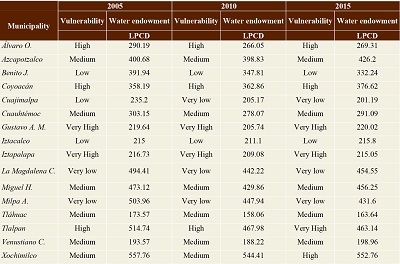 |
The municipalities that are to the south of the city have the highest water endowment. Xochimilco has the highest endowment, but it is striking that it has a Very High vulnerability; Tlalpan follows it concerning endowment. In a certain way, they share vulnerability since both went from High to Very High, and Magdalena Contreras would occupy third place in the endowment. Still, it is striking that it had Very Low Vulnerability. On the other hand, Tláhuac, Venustiano Carranza, and Cuajimalpa presented the lowest water endowment with a Medium, Moderate, and Very Low vulnerability, respectively. In these areas, it is necessary to highlight the role of Cuajimalpa because despite having a tiny water endowment, its vulnerability was Low. It is essential to mention that the amount of water these municipalities receive through pipes is unknown, making this result vary.
In rainwater harvesting systems (SCALL), Mexico City has 13,939 installed in three municipalities until 2019. For comparison purposes, we compared the vulnerability classification of 2015 with the SCALL of 2019. Efforts made in the rainwater harvesting area concentrated in the municipalities with High and Very High vulnerability classifications. Xochimilco has 4,663 SCALL and a High degree of vulnerability, Tlalpan has 3,276 SCALL and Very High vulnerability, and Iztapalapa has 6,000 SCALLs and Very High vulnerability. However, municipal governments that require SCALL implementation stand out, as is the case of Álvaro Obregón, Coyoacán, and especially Gustavo A. Madero, due to the High vulnerability index for the first two and Very High for the third.
- Discussion
Mexico City is a clear example of unequal access to water resources by members of society, a situation that underscores the importance of developing adaptation proposals that mitigate this problem. In Mexico City, the limited water availability is well known to the citizens and the government. It is reflected in the evident dependence on external sources for its supply, but the actions that mitigate this situation have not been sufficient. So now, the results of water social vulnerability studies require proposals that contribute to containing and reducing the problem.
The results obtained fill an essential space for planning activities focused on improving the use and care of water. These are an addition to the limited previous studies undertaken on vulnerability (Cutter, 1996; Adger and Kelly, 1999; Cutter et al., 2000; Brooks, 2003; Adger et al., 2004; Adger, 2006; Eakin and Luers, 2006; Navarro and Larrubia, 2006; Martínez et al., 2009; Hamouda et al., 2009; Monterroso et al., 2014; González et al., 2016). Previous actions have helped to avoid the misuse and expense of the water. Still, their monitoring and evaluation are minimal, making it difficult to rethink the actions with practical experience. This new study generates a solid base on which it is possible to grow and follow up on the implemented measures, allowing adaptation as needed.
This essay studies the processes that impact vulnerability in Mexico City at the Municipality level as they correspond to the lowest government management unit for which we found reliable data. Vulnerability at this scale behaves as a dynamic and meticulous process that limits the scale of analysis and its energy. Also details the problem, gives reliability to the data, facilitates the ability to compare, understand and manage the information from responsible sources, and allows the management of their data (Adger et al., 2004). In this regard, in each Municipality, a unique combination of indicators is the one that places them at some particular level of vulnerability. For the same reason, each Municipality must take up the problem to understand the causes of its situation, which in principle could be similar to other municipalities, but the detail makes the difference. Thus, Gustavo A Madero, Iztapalapa, and Tlalpan are the most vulnerable. Gustavo A. Madero has to work on urbanization problems, population size, and economic units. In contrast, Iztapalapa shares issues such as urbanization, population size, and economic units with the former, but conflicts with water leaks, water shortages, and poor quality reports are accentuated. Finally, urbanization in Tlalpan is also a common problem with the other two municipalities. Still, water leaks and poor quality reports emphasize its problems and make it similar to Iztapalapa in terms of the factors that make them vulnerable.
The municipalities of Milpa Alta, Magdalena Contreras, and Cuajimalpa contrast due to their low vulnerability, but this does not mean that they do not have problems. For example, Milpa Alta must implement adaptation measures since its Low vulnerability is because a large part of the water supply is carried out by supplying pipes. Magdalena Contreras has opportunities for correcting water leaks and water shortages. Similarly, Cuajimalpa could make an effort to implement water treatment.
The indexes calculated in this study (Appendix E) and the empirical evidence generated make it clear that reducing the values of the vulnerability indexes will achieve an adequate supply, limiting the availability of water for personal and industrial use of citizens and/or companies. As was evident above, the calculated vulnerability of the municipalities (Figure 4) highlights the need to take action not only by the municipalities but by the city as a whole, since only in this way the water conditions they present today will be improved and adapted (Naciones Unidas, 2012). The situation is particular for each Municipality since demand varies and depends on various factors. For example, the correlation between GDP, urbanization, and water supply is not always positive. Thus, it is noticeable that municipalities such as Iztapalapa, Tlalpan, and Gustavo A. Madero, which have extensive urbanization (Figure 5) and receive a more significant amount of water, participate in a limited way in GDP. This situation suggests that they use more water for domestic consumption and contribute less to the goods and services that generate GDP.
This approach allowed the recognition of 11 situations considered a priority and required a specific study to apply mitigation actions. A positive aspect of this methodology is that it can assess the effectiveness of the measures over time, reflecting whether vulnerability increases or decreases.
Problems in obvious need for action:
1). Accelerated growth. Urbanization is one of the factors that affect most water vulnerability. Urbanization processes reduce green areas and the infiltration of rainwater (Abellán, 2016) causing floods due to the change in soil permeability (Salas et al., 2019). Accelerated urban growth is observed in the periphery of the city, which, according to SEDUVI, responds to high migration (Magallanes, 2016). Undoubtedly, the urbanization process increases the pressure on ecosystems and their services. Water is essential for life and supports any country’s economic and social development (Sánchez et al., 2012), since it is used in practically all human activities, such as agriculture, power generation, industrial processes, navigation, among others (Almirón, 2004).
In addition, the tubing of rivers that Mexico City suffered in the first half of the last century affects the natural recharge capacity of the precious liquid (Zambrano, 2017). As there is limited recharge and a massive water waste, the supply in different city areas generates unequal impacts, thus amplifying the need to create sustainable proposals for its management (Rolland and Vega, 2010). Iztapalapa and Gustavo A. Madero municipalities exemplified the problem, which share high population rates with the highest degree of urbanization throughout the study period and consequently occupy the highest level of vulnerability within Mexico City. The Municipality Tlalpan is a worrying case since it has registered the most significant positive slope of urban growth in recent years and occupies one of the essential recharging areas of the Mexico City Metropolitan Area Aquifer. In contrast, Milpa Alta and Cuajimalpa represent areas with the lowest urban growth rate and have the lowest population rates, which certainly places them as the least vulnerable municipalities in Mexico City, along with Magdalena Contreras.
Other studies around the world detail in depth the alterations of urbanization processes in the natural hydrological cycle. However, some of them indicate that the effects on the aquifer are not always adverse, as in the case of Hyderabad, in India, where water leaks play a vital role in the aquifer’s recharge (Wakode et al., 2018). In Mexico City, the water lost due to leaks can also contribute to the aquifer’s recharge. Still, it is essential to note that these limit the fulfillment of providing water in sufficient quantities to the population and its economic units.
2). People are exposed. The number of inhabitants (INEGI, 2015) reflects individuals exposed to any threat, so the more inhabitants, the greater the exposure to danger. For example, droughts in China, one of the most populated areas in the world, are the country’s greatest threat. According to Chen and Sun (2019), droughts will be more frequent and more intense over the following years, and projections suggest that the exposed population will increase by approximately 17%.
In this study, we observed that not all municipalities are growing in population number; some are decreasing, such as Azcapotzalco, Coyoacán, Cuauhtémoc Gustavo A Madero, Iztacalco, Miguel Hidalgo, and Venustiano Carranza. According to SEDUVI this depopulation is due to high housing costs, which is why people have moved to the city’s periphery, leading to wear and tear in the long trips to their jobs and financial expenses (Magallanes, 2016).
However, in total, the city is growing in inhabitants number (INEGI, 2015,2020). This indicator was vital for the assessment since the municipalities with the highest vulnerability index are the most populated such as Iztapalapa and Gustavo A. Madero. In contrast, the least populated turned out with the slightest vulnerability, such as Milpa Alta, Cuajimalpa, and Magdalena Contreras.
3). Businessmen and entrepreneurs. Water is one of the essential inputs in the production process (Revollo et al., 2020). Economic units represent individuals who contribute to GDP through various establishments or businesses (INEGI, 2014). They depend on the continuous supply and quality of the water, so they are highly exposed to problems in the water supply to develop their economic activities (Chenoweth, 2008). The economic units as a whole are undoubtedly vulnerable to water scarcity. The concentration of industries in the Iztapalapa, Cuauhtémoc, and Gustavo A. Madero municipalities implies an enormous water supply. The presence of soft drink and beer factories that require massive amounts of liquid is well known (Lara, 2019). Restaurants also need a high water supply to keep their establishments in optimal cleanliness, health, and hygiene (Velasco, 2020). Of these three municipalities, which invest considerable amounts of water, only Cuauhtémoc participates with a high GDP, which suggests that it pays for receiving this liquid in some way. The other two municipalities should contribute to the balance of their vulnerability due to their location in the average of the contribution in Mexico City in terms of GDP. It is noteworthy that the municipalities with less urbanization, Milpa Alta, Magdalena Contreras, and Cuajimalpa (Figure 5), have minor economic units (INEGI, 2014). So they could study the impulse of these in their jurisdiction in a planned way, which would also help them increase their contribution to the GDP. In other words, large companies are located in the most vulnerable municipalities and therefore have larger economic units. In contrast, the lower GDP generated in the other municipalities may be due to the absence of these large businesses and the more significant number of small businesses. That is, small companies, even combined, do not compete with large establishments.
It is a fact that water is related to economic activities, as demonstrated by Saudi Arabia, one of the wealthiest countries in the Middle East. In addition to oil exploitation, they based their economy on oasis agriculture (Beaumont, 1977). However, if they continue with the current water extraction rate, considering the population increase, they could face a severe water crisis (Hidroconta, 2020).
4). Culture water. It is also important in understanding vulnerability the major impact that water waste has on the daily quota of liquid per inhabitant in Mexico City (Table; (Centro Virtual de Cambio Climático de la Ciudad de México, 2011). This severe problem requires much more decisive actions as it represents a loss of water throughout the distribution network of between 30% and 70% of the liquid, depending on the area (Sheinbaum, 2008). Through citizen participation, we obtained the number of water leaks, which often depends on the culture and the value of water. Nevertheless, not necessarily all water leaks are reported. However, they are a good approximation of reality. We found the highest participation is in the municipalities of Coyoacán, Tlalpan, and Iztapalapa. In contrast, the minor participation or possibly the municipalities with fewer water leaks were Milpa Alta, Cuajimalpa, and Venustiano Carranza. There is no data that allows the calculation of the length and age of the water infrastructure vs. the number of leaks. This relationship may hide a reality that needs investigation.
Cities with significant leakage problems like Tokyo have developed one of the world’s most efficient water systems. They use technology capable of detecting and replacing water leaks, which has halved the amount of water wasted by the city in recent years, benefiting the population (C40 Cities, 2012).
5). Challenge to meet. Addressing the water shortage is one of the most significant challenges that the city faces to meet the population’s basic needs (Velasco et al., 2014). Through the reports of water shortages, citizens participate so that the authorities can solve this problem (SEAPAL Vallarta, 2016). Deficits can be due to various factors ranging from natural processes (droughts that reduce the volume of water in supply sources) to human-influenced methods (water resource management, arrangements, or improvements in supply systems, etc.). In this situation, alternative strategies are required, such as collecting rainwater and supplying water through pipes, as in the Tlalpan and Milpa Alta municipalities (Espinosa, 2017). Unlike the reports of water leaks, it is easier for people to report water shortages, as exemplified by Iztapalapa, Benito Juárez, and Cuauhtémoc. In contrast, there are few reports of water waste, such as Milpa Alta, Cuajimalpa, and Tláhuac. The distribution of water can also influence this situation through pipes. In other places (e.g., São Paulo, Brazil, and California, USA), the shortage of water or drought events is faced following strict plans that include water use restrictions (Cambareri, 2017).
6). Active participation. Another element that was key for vulnerability assessment is water quality (Escolero et al., 2016). However, it is necessary to emphasize the lack of data when including it in the evaluation (Perevochtchikova, 2013).
When looking for indicators related to this problem and incorporating them into this study, we found that one of the main barriers to accessing the indicator is that there are not enough measurements covering an entire municipality’s water quality. Given this situation, we used the number of poor water quality reports made by citizens in each Municipality as a proxy indicator. Although there are no specific parameters that indicate how good or bad the water quality is, the number of reports is a good proxy in this case. Most importantly, it includes the participation of the inhabitants of each Municipality (Table 1). In this sense, we found more involvement in the municipalities of Iztapalapa, Xochimilco, and Tlalpan. It is important to mention that according to Mazari et al. (2019) in Iztapalapa and Xochimilco it is observed a high vulnerability in water quality. At the same time, the least participative or possibly with better water quality were Magdalena Contreras, Milpa Alta, and Cuajimalpa. Again, the distribution by pipes can generate a biased approach to this problem, but for the moment, it is the only one that produces a perception of the quality of the water.
In water quality, The United States has one of the safest water supplies in the world (Centers for Disease Control and Prevention, 2020). The U.S. Geological Survey collects, monitors, analyzes, and provides a scientific understanding of natural resource conditions, in this case, water (USGS, 2021). These initiatives allow keeping informed to the population about the characteristics of the water and the implementation of similar initiatives urged in the municipalities and Mexico City.
7). Handing out the treasure. The amount of water available to each Municipality varies, and much depends on the number of inhabitants (Breña and Breña, 2007). However, it is essential to clarify that not all the water that supplies each Municipality is for human consumption. The liquid is also necessary for agricultural, domestic, industrial, livestock, recreational, commercial or services, and electricity generation (Comisión Nacional del Agua, 2015a, 2015b, 2015c), among other uses. The cases of Iztapalapa, Tlalpan, and Gustavo A. Madero stand out since they are the municipalities that receive the most water. However, the number of inhabitants is so high that the resource distribution is more limited per inhabitant. On the other hand, the municipalities that receive little water, such as Cuajimalpa, Tláhuac, and Iztacalco, do not necessarily correspond with municipalities with a minor distribution of the liquid depending on other factors unrelated to the number of inhabitants.
Other countries in the Middle East or North Africa face even more difficult situations with high population growth rates, resulting in lower water per capita. Currently, they implement strategies focused on increasing supply, such as desalination, treatment, and reuse of wastewater (Roudi et al., 2002).
8). Recovering the precious liquid. To achieve a more complete and sustainable vision of water management is necessary to consider mechanisms to recover the liquid (Mazari and Noyola, 2019)and establish actions for its treatment so that the city can use this water treated in different aspects of the complex and intricate life (Table 1; (Consejo de Evaluación del Desarrollo Social del Distrito Federal, 2010; de la Vega, 2012).
Given the deficit of drinking water, during the 1950s, the first water treatment plants that helped maintain the levels of lakes, canals, and irrigation of green areas emerged in the city (Consejo de Evaluación del Desarrollo Social del Distrito Federal, 2010).
Water treatment plants nowadays represent a measure to contribute to the water balance of the city since this last one uses wastewater as an additional source of water. However, it is not yet recognized as such (Consejo de Evaluación del Desarrollo Social del Distrito Federal, 2010). Iztapalapa leads this unrecognized use of wastewater, where the most significant volume of treated water is used, followed by Gustavo A. Madero and Coyoacán. Municipalities with the highest vulnerability index (I, GAM) concentrate efforts on wastewater treatment, accompanied by Coyoacán, with a High vulnerability.
Existing wastewater treatment systems have decreased their water treatment and quality efficiency due to maintenance, rehabilitation, and/or replacement costs, tiny implementation of state-of-the-art technology, and new sanitation processes (de la Vega, 2012). The above partially explains why there are municipalities where water is not treated, such as Benito Juárez, Cuajimalpa, and Venustiano Carranza.
Studies show the benefits of treating wastewater, especially in Africa, where they struggle to access adequate amounts to meet their needs. Mainly these waters can be used for various purposes such as garden irrigation and industrial processes (Adewumi et al., 2010). Following the South Africa example, Mexico City and its municipalities can find ample opportunities to implement water reuse.
9). Wealth and budget. Practically two municipalities of Mexico City concentrate the GDP, Cuauhtémoc, and Miguel Hidalgo, which shows the need to balance economic development in the rest of the municipalities, possibly with programs that help small businesses grow in terms of economy (Gobierno de México, 2019). Although it is not an indicator that directly reflects the water situation of each Municipality, it does give a good idea of how prepared their economy is to face waste problems. (Espinosa, 2017)
According to Sanctuary et al. (2005), water and the economy are “inextricably linked.” The same authors expose that improved water supply and sanitation, and water resources management impulses economic growth and certainly help poverty eradication.
10). Dividing the resource. The water endowment affects the adaptation of each Municipality. Theoretically, the more water that corresponds to each inhabitant will significantly improve their vulnerability index (Quintero, 2020). However, the results suggest that it is necessary to take care of other aspects of the water supply. It is also required to balance this supplement in all municipalities since there are significant variations in each. The case of Xochimilco stands out for having the most critical water endowment, but even so, it went from Moderate to Very High vulnerability in 2015 (Table 2). Due to its wetland and traditional chinampa system, Xochimilco is recognized for its culture and environmental value and represents one of the most significant sustainability challenges in Mexico City (Jiménez et al., 2020).
On the other hand, Tlalpan is even more severe than the case of Xochimilco since it went from having High to Very High vulnerability in 2015 and had the highest water endowment during this period, making it the second-largest recipient of water endowment. The measure of water endowment has relativity in terms of water availability per inhabitant. Not all people have the same access and water endowment in the municipalities, especially if we consider irregular urban settlements (García, 2014; Gómez and Palerm, 2015). There is no connection to the urban drinking water network in irregular urban territories, and consequently, they resort to other means for their supply, such as well water, rivers and streams, cisterns, bottled water and water pipes (Gómez and Palerm, 2015; Espinosa, 2017; Revollo and Rodríguez, 2021). Unfortunately, these solutions entail high economic costs and/ or poor water quality. Xochimilco and Tlalpan turned out to be paradoxical since although they have the highest water endowment per inhabitant, their vulnerability index is increasing. The situation suggests that their condition may worsen in both cases if the water supply decreases, like in Tlalpan, where there is a significant decrease in its supply. In contrast, the municipalities that follow Tlalpan and Xochimilco concerning water endowment are Milpa Alta and Magdalena Contreras, which have Very Low vulnerability (Figure 4). This situation suggests that Milpa Alta and Magdalena Contreras have developed essential practices to combat water vulnerability. The analysis of these practices can be helpful for their application in other municipalities. On the other hand, the municipalities with the least water supply are Tláhuac, Venustiano Carranza, Cuajimalpa, and Iztapalapa. The first two have a Medium vulnerability index, but surprisingly, the case of Cuajimalpa, despite not having a high endowment, is very low. The above example shows that it is unnecessary to have massive amounts of water to reduce the vulnerability index; with good resource management, municipalities can satisfy their basic needs.
Worldwide, Mexico City is one of the cities where the most water is consumed, with a water supply up of to 360 liters per inhabitant (Ordoñez, 2019), unlike countries like Peru, where an average of 163 liters of water per day per inhabitant (Huaquisto and Chambilla, 2019). However, in Peru itself, there are significant differences in the provision of water since there are places such as San Isidro, Lima, and Miraflores where the consumptions reach 477 and 436 liters per person respectively, while in areas like Puno they hardly get 100 liters per person (Huaquisto and Chambilla 2019). The most significant water supply cases are above those recommended by the WHO, 100 liters per day.
11). Harvesting rain. Another adaptation measure that seeks to reduce vulnerability is the harvest of rainwater carried out by the Isla Urbana Association. This harvest is an adaptation measure at the local level, which could positively impact the aquifer’s recharge in the long term. The measure must be carried out throughout the entire city since, at the moment, the effort made has benefited only three municipalities, Iztapalapa, Tlalpan, and Xochimilco. Of course, its contribution depends on the number of rain systems installed and the evaluation period for this measure. The importance of this work lies in the contribution of these systems to mitigate the problem at the local level, as suggested by their assistance to municipalities with Very High vulnerability, Iztapalapa and Tlalpan, and High in Xochimilco.
The need for systems that store rainwater is evident as it could help other municipalities reduce their vulnerability level. Gustavo A. Madero, Álvaro Obregón, and Coyoacán are considered priorities for having Very High vulnerability in the former and High the other two. The Impact of an adaptation action like this can be seen immediately or in the long term, but it will undoubtedly help better manage water scarcity in municipalities and cities (Brooks 2003; Corfee et al. 2011). In the municipalities mentioned, the time and other parallel actions will highlight the value of water harvest. Note that in Mexico City, there is a paradoxical situation. It is a city with plenty of water and, at the same time, lacks it (Perló and González, 2005; Eakin et al., 2017). It rains in abundance from June to October, which causes a large part of the city to suffer flood events, unlike other countries where climatic conditions make the rainfall erratic and highly variable, such as Sudan, Ethiopia, and Egypt (Hamouda et al., 2009). However, Mexico City does not yet store rainwater (although there are projects that plan it), and this advantage is almost not used to satisfy the water economy.
Vulnerability increases over time and some factors do not solve the problem; on the contrary, they qualify it. For example, Mexico City is one of the primary consumers of bottled water due to the poor quality of the water in the house or because of the perception that citizens have of the quality as not suitable for drinking (Pacheco, 2015). This situation means that families have to invest part of their income in the purchase of bottled water. This spending affects low-income families the most. On the other hand, the lack of continuity in the water supply in the house has led families and now mandatory construction companies to incorporate both underground water tanks (cisterns) and roofs (tinacos). A situation also represents an additional expense for families (pers. com. Zamora-Saenz, I., 2021).
A third factor would be climate change. The impacts of this situation are already occurring. In the case of rains, the increase in extreme hydrometeorological events produces severe floods that affect the not prepared City (Vera and López, 2010). In contrast, prolonged droughts will lead to a significant increase in water resources consumption and negatively affect supply sources by reducing storage levels (Martínez et al., 2015).
The processes or measures of adaptation to water vulnerability require coordination and consensual decisions that involve private agents, companies, civil society, public organizations, and governments at the local, regional and national levels, including international agencies (Adger et al., 2005). The analysis of indexes such as urbanization and inhabitants highlight essential components that require attention by the mayor’s office and the head of government of Mexico City. Within the Municipality, actions are expected to bring citizens closer to the government to indicate problems, point out deficiencies, suggest improvement campaigns, process permits for land use or modification, etc. The municipalities government itself should be an intermediary to promote actions at the city level where the proposals from different municipalities can be brought together and be better focused.
How responsibilities for water are divided in Mexico complicates its correct administration at different levels of government. For example, the Federal Government, through CONAGUA, manages the country’s water, while SACMEX administers the water that reaches the city. Unfortunately, at the municipal government level, there is no one responsible for the distribution of water. However, the municipal governments receive comments and complaints about the water service and send the information to SACMEX.
Any policy in which the authorities intervene to reduce vulnerability needs to involve society central and irreplaceable. The community needs to know the mechanisms that cause vulnerability (Adger, 2006), and at the same time, must be able to act on different scales that commit people to better water care (Turner et al., 2003).
The results obtained in this study and their discussion reveal the need to increase the quantity and quality of data to carry out increasingly detailed studies and focus on particular problems. For example, having data to argue better the need to reduce vulnerability with a focus on health will generate better projects with firm and solid support. It is also needed that studies are carried out on the distribution of water through pipes and the quality of the water that the families received since it is an alternative source of supply water that with the current data could not be considered. It is no less important to obtain direct data on the availability of water supply from external sources since in this work, we estimated these data from SEDEMA information.
The vulnerability measured up-to-date shows conditions aggravated by other diverse threats such as drought, scarcity, damage and poor maintenance of infrastructure, lack of awareness and citizen education, limited social and governmental commitment, etc. For example, in 2020, the world faced a pandemic from the SARS-CoV-2 (COVID-19) virus. Among the measures established to combat the virus were frequent hand washing, object cleaning, and practicing hygiene in general. Compliance with these measures requires large amounts of water, as happened with influenza in 2009. When the world faced the latter, consumption increased by approximately 30% (Centro Virtual de Cambio Climático de la Ciudad de México, 2011). Given the uncertainty of the duration of the pandemic due to COVID 19, water consumption may increase and last indefinitely. This situation highlights the need to reduce vulnerability as a precautionary measure against future health threats.
According to data published by the Government of Mexico City, the municipalities with the highest number of COVID 19 cases have been Gustavo A. Madero, Iztapalapa, and Tlalpan (Gobierno de la Ciudad de México, 2020). The same municipalities in this study have a higher vulnerability index for 2015. The trend of this water vulnerability is increasing, as exemplified by the cases of Tlalpan and Xochimilco, which increased their levels of vulnerability, which suggests that the municipal governments in question are not prepared to face threats that put health at risk.
- Conclusion
The observations made with the indicators confirm that the high population density and the expansion of the urban area in Mexico City have caused instability in water resources (CONAGUA, 2012b, 2014). In this same urban growth area, paving affects the aquifer’s recharge as it generates an impermeable layer that prevents water from infiltrating the subsoil (CONAGUA, 2012b). Inevitably this situation complicates the provision of services and drainage, which certainly influences the discharge of untreated wastewater into natural systems such as rivers and lakes or contaminating absorption wells or even the street (Ezcurra, 1996). Dumping wastewater into untreated waterways, and mixing these waters with rainwater limits the amount of water that could be used to cover part of the demand. This is a specially important problem in the municipalities that presented the highest vulnerability index (Gustavo A. Madero, Iztapalapa and Tlalpan, followed by Álvaro Obregón, Coyoacán, and Xochimilco).
These problems continue to grow, and together with the intensive extraction of the aquifers that supply Mexico City (Metropolitan Area of Mexico City, Texcoco, and Chalco-Amecameca), they have led to the transport and use of water from other basins to meet demand.
Despite these efforts, different levels of water vulnerability are registered in each Municipality. Some have maintained Very High and High vulnerability over 15 years, such as Gustavo A. Madero, Iztapalapa, Álvaro Obregón, and Coyoacán. This situation emphasizes the urgency to act not only in these municipalities that reflect severe problems but in others whose indicators suggest a high risk of moving away from more sustainable practices, such as Xochimilco and Tlalpan.
The vulnerability index generated in this study for each Municipality highlights areas with the most significant challenges towards sustainable development, among them, Gustavo A. Madero, Iztapalapa, and Tlalpan. Less vulnerable areas with more significant potential to implement measures that help improve management in their water resources, include Milpa Alta, Magdalena Contreras, and Cuajimalpa. Curiously, these municipalities are contrasting in terms of population density, water infrastructure, and urbanization, which suggests that it is essential to increase the invitation to society of the first municipalities to improve the use and care of water. Action must be taken to solve the large number of leaks and reports of poor water quality.
Another consequence, especially of unplanned urban growth, is the irregular urban settlements on the city’s periphery, which receive water inconsistently. This water has poor quality or is not connected to the water network or drainage. As a result, it unleashes a series of consequences that affect both society and the environment. In the absence of supply and discharge networks, people look for temporary, expensive, and inappropriate solutions. Like access to water through pipes and discharge the wastewater without any treatment to the subsoil.
Surprisingly, Mexico City as a whole, under current conditions, has a very worrying degree of vulnerability (Velasco et al., 2014) since it does not come out utterly OK because of its Medium vulnerability index. This situation suggests that there is water availability for citizens with current water resources. Nevertheless, we can not postpone the taking of measures that promote sustainability. Future studies should consider the population density, the degree of economic activity, and the involvement of society. They inevitably should add indexes that explore the role of population concentration in conditions of poverty and the requirements of hydraulic infrastructure (Corfee et al., 2009). A final recommendation is to pay special attention to the role of irregular urban settlements. Because in them there is a significant lack of hydraulic infrastructure, high population density, and a substantial impact on the aquifer’s recharge by waterproofing the soil (Procuraduría Ambiental y del Ordenamiento Territorial, 2010).
The observations made highlight that social vulnerability is a complex concept. Difficult to quantify, but that involves quantitative elements that revolve around society, the environment, and the economy, which must be evaluated over time and reflect the state and commitment of the municipalities and the government of Mexico City.
The results achieved indicate that the leading social, environmental, and economic causes that constitute social vulnerability are part and consequence of the drinking water supply system of Mexico City. As a result of processes in which humans actively participate and can almost always be prevented.
The study highlights how acting on vulnerability to mitigate requires the joint action of municipalities, Mexico City, and sometimes even the Federal Government, in addition to non-governmental organizations, society, and private initiatives (e.g., Acevedo et al., 2013).
Another point of interest that this study highlight is the importance of knowing the system’s state and becoming familiar with its evolution to explore measures to help address possible negative impacts (Eakin and Lemos, 2010). Knowing the vulnerability helps manage crises or avoid them, facilitating planning and helping to implement sustainability. This action will limit adverse conditions and allow preventive measures. A final reflection applicable to any other city that faces water shortage would be that no unique group or authority is responsible for water problems. It should be attended at different scales (Cash et al., 2006) by local, regional, and higher authority levels (Arreguín et al., 2010) and society in general, including the academy and private sector.
Researchers can use the methodologies used and developed in this study for future studies in other cities or at a local level. The only requirement is to generate or have the information that supports indicators.
Author contributions
The conceptualization, methodology, software management, and writing were completed by Huerta-Vergara Alma R. Arciniega-Esparza Saúl contributed with formal analysis and writing review. Pedrozo-Acuña Adrián was in charge of supervision, resources and project administration. Matus-Kramer Arnoldo also was involved in supervision, resources and project administration. Vega-López Eduardo contributed with conceptualization, writing and reviewing the manuscript.
Acknowledgments
The first author gratefully acknowledges the Program in Sustainability Sciences, UNAM (Posgrado en Ciencias de la Sostenibilidad, Universidad Nacional Autónoma de México); CONACYT for supporting her studies with the scholarship 607531; The Engineering Institute, UNAM facilitated space and equipment; Dr. Marisol Anglés Hernández and Dr. Enrique César Valdez are recognized for their involvement at the initial planning of this study; Isla Urbana Association for providing data; Sergio R. S. Cevallos Ferriz for reviewing the article and suggestions; Laurie LaBerge, Roz Wheatley and Paulina Madrigal Briones for the assistance with English version; Academic Writing Program-UNAM for recommendations to improve the manuscript; The reviewers of the journal for their comments and suggestions that certainly improved the manuscript.
Financing
This research did not receive any specific grant from financing agencies in the public, commercial, or not-for-profit sectors.
Conflicts of interest
The authors have declared that no Conflicts of interest exist.
References
Abellán, A., 2016, Los impactos de la urbanización en el ciclo del agua: España, iAgua. https://www.iagua.es/blogs/ana-abellan/impactos-urbanizacion-ciclo-agua (accessed September 2021).
Acevedo, B., Matthew, B., Johnson, A., Weiner, J., 2013, The institutional structure of water policy in the Mexico city Metropolitan Area: México, Consejo Consultivo del Agua, A.C., Universidad del Sur de California, 19p.
Adewumi, J.R., Ilemobade, A.A., van Zyl, J.E., 2010, Treated wastewater reuse in South Africa: Overview, potential and challenges: Resources, Ronservation and Recycling, 55(2), 221–231. http://doi.org/10.1016/j.resconrec.2010.09.012
Adger, W.N., 1999, Social vulnerability to climate change and extremes in Coastal Vietnam: World Development, 27, 249–269. http://doi.org/10.1016/S0305-750X(98)00136-3.
Adger, W.N., 2006, Vulnerability: Global Environmental Change, 16, 268–281. http://doi.org/10.1016/j.gloenvcha.2006.02.006.
Adger, W.N., Arnell, N.W., Tompkins, E.L., 2005, Successful adaptation to climate change across scales: Global Environmental Change, 15, 77–86. http://doi.org/10.1016/j.gloenvcha.2004.12.005.
Adger, W.N., Brooks, N., Bentham, G., Agnew, M., Eriksen, S., 2004, New indicators of vulnerability and adaptive capacity: United Kingdom, Tyndall Centre for Climate Change Research Norwich, 120p.
Adger, W.N., Kelly, P.M., 1999, Social vulnerability to climate change and the architecture of entitlements: Mitigation and Adaptation Strategies for Global Change, 4, 253–266. http://doi.org/10.1023/A:1009601904210.
Almirón, E., 2004, El agua como elemento vital en el desarrollo del hombre, in Observatorio de Políticas Públicas de Derechos Humanos en el Mercosur (ed.), Políticas Públicas de Derechos Humanos en el MERCOSUR, un compromiso regional: Montevideo, Uruguay, Observatorio de Políticas Públicas de Derechos Humanos en el Mercosur, 217–229.
Arreguín Cortés, F., Alcocer Yamanaka, V., Humberto, M.M., Cervantes Jaimes, C., Albornoz Góngora, P., Salinas Juárez, M.G., 2010, Los retos del agua, in Jiménez Cisneros, B., Torregrosa y Armentia, M.L., Aboites Aguilar, L. (eds.), El Agua en México: Cauces y Encauces: Ciudad de México, Academia Mexicana de Ciencias, 51–77.
Banco Interamericano de Desarrollo (BID), 2012, Modelo de marco institucional para la Gestión de los recursos hídricos en el Valle de México. Primer Informe: México, MAV, 302p.
Beaumont, P., 1977, Water and development in Saudi Arabia: The Royal Geographical Society, 143(1), 42–60. https://doi.org/10.2307/1796674
Breña Puyol, A.F., Breña Naranjo, J.A., 2007, Disponibilidad de agua en el futuro de México: Ciencia, 64–71.
Brooks, N., 2003, Vulnerability, risk and adaptation: A conceptual framework: UK, University of East Anglia, Tyndall Centre for Climate Change Research, 20p.
Brooks, N., Adger, W.N., Kelly, P.M., 2005, The determinants of vulnerability and adaptive capacity at the national level and the implications for adaptation: Global Environmental Change, 15, 151–163. http://doi.org/10.1016/j.gloenvcha.2004.12.006
C40 Cities, 2012, Tokyo, World Leader in Stopping Water Leakage, https://www.c40.org/case_studies/tokyo-world-leader-in-stopping-water-leakage (accessed January 2021).
Cambareri, G., 2017, Robust drought planning in megacities: A case study in São Paulo, Brazil. Environmental and Water Resources Engineering Masters Projects 82: USA, University of Massachusetts Amherst, Master’s Project Report, 104 p. https://doi.org/10.7275/wzee-d052
Cash, D.W., Adger, W.N., Berkes, F., Garden, P., Lebel, L., Olsson, P., Pritchard, L., Young, O., 2006, Scale and cross-scale dynamics: Governance and information in a multilevel world: Ecology and Society, 11(2), 8. http://doi.org/10.5751/es-01759-110208
Centers for Disease Control and Prevention, 2020, Importance of water quality and testing: USA, U.S. Department of Health and Human Services. https://www.cdc.gov/healthywater/drinking/public/water_quality.html (accessed January 2021).
Centro Nacional de Prevención de Desastres, 2018, Lluvias importantes en la Ciudad de México: México, Centro Nacional de Prevención de Desastres. https://www.gob.mx/cenapred/articulos/lluvias-importantes-en-la-ciudad-de-mexico (accessed September 2021).
Centro Virtual de Cambio Climático de la Ciudad de México, 2011, Pobreza, agua y cambio climático en la Ciudad de México:México, UNAM, PUEC.
Chen, H., Sun, J., 2019, Increased population exposure to extreme droughts in China due to 0.5 °C of additional warming: Environmental Research Letters, 14, 1–9. http://doi.org/10.1088/1748-9326/ab072e
Chenoweth, J., 2008, A re-assessment of indicators of national water scarcity: Water International, 33, 5–18. http://doi.org/10.1080/02508060801927994
Comisión Nacional del Agua (CONAGUA), 2015a, Actualización de la disponibilidad media anual de agua en el acuífero Chalco-Amecameca (1506), Estado de México: México, CONAGUA, Subdirección General Técnica Gerencia de Aguas Subterráneas, 36p.
Comisión Nacional del Agua (CONAGUA), 2015b, Actualización de la disponibilidad media anual de agua en el acuífero Texcoco (1507), Estado de México: México, CONAGUA, Subdirección General Técnica Gerencia de Aguas Subterráneas, 41p.
Comisión Nacional del Agua (CONAGUA), 2015c, Actualización de la Disponibilidad Media Anual de agua en el Acuífero Zona Metropolitana de la Ciudad de México (0901): México, CONAGUA, Subdirección General Técnica Gerencia de Aguas Subterráneas, 35p.
Comisión Nacional del Agua (CONAGUA), 2014, Estadísticas del agua en México: Ciudad de México, Secretaría del Medio Ambiente y Recursos Naturales, CONAGUA, 242 p.
Comisión Nacional del Agua (CONAGUA), 2012a, Programa Hídrico Regional Visión 2030 (Secretaría del Medio Ambiente y Recursos Naturales, Ed.): México, D.F., Secretaría del Medio Ambiente y Recursos Naturales, 228 p.
Comisión Nacional del Agua (CONAGUA), 2012b, Programa hídrico regional visión 2030. Región hidrológico-administrativa IX Golfo Norte: México, SEMARNAT, CONAGUA, 178p.
Comisión Nacional del Agua (CONAGUA), 2015, Plantas de tratamiento de agua residual http://sina.conagua.gob.mx/sina/tema.php?tema=plantasTratamiento&ver=mapa
Conrad, O., Bechtel, B., Bock, M., Dietrich, H., Fischer, E., Gerlitz, L., Wehberg, J., Wichmann, V., Böhner, J., 2015, System for Automated Geoscientific Analyses (SAGA): Geoscientific Model Development, 8, 1991-2007. https://doi.org/10.5194/gmd-8-1991-2015
Consejo de Evaluación del Desarrollo Social del Distrito Federal, 2010, Evaluación externa del diseño e implementación de la política de acceso al agua potable del Gobierno del Distrito Federal: México, UNAM, 259p.
Corfee-Morlot, J., Cochran, I., Hallegatte, S., Teasdale, P.J., 2011, Multilevel risk governance and urban adaptation policy: Climatic Change, 104, 169–197. http://doi.org/10.1007/s10584-010-9980-9
Corfee-Morlot, J., Kamal-Chaoui, L., Donovan, M.G., Cochran, I., Robert, A., Teasdale, P.-J.J., 2009, Cities , climate change and multilevel governance: Paris, OECD Environmental Working Papers, 125p. http://doi.org/10.1787/220062444715
Cutter, S.L., 1996, Vulnerability to environmental hazards: Progress in Human Geography, 20, 529–539, http://doi.org/10.4324/9781849771542
Cutter, S.L., Mitchell, J.T., Scott, M.S., 2000, Revealing the vulnerability of people and places: A case study of Georgetown County, South Carolina: Annals of the Association of American Geographers, 90, 713–737. http://doi.org/10.4324/9781849771542
de la Vega Salazar, M.Y., 2012, Eficiencia en plantas de tratamiento de aguas residuales. Contribución a la gestión y desarrollo social:México, INDESOL, SEDESOL, Refugia Centro para la Conservación de la Ecobiodiversidad A. C., 122 p.
Eakin, H., Bojórquez-Tapia, L.A., Janssen, M.A., Georgescu, M., Manuel-Navarrete, D., Vivoni, E.R., Escalante, A.E., Baeza-Castro, A., Mazari-Hiriart, M., Lerner, A.M., 2017, Urban resilience efforts must consider social and political forces: Proceedings of the National Academy of Sciences of the United States of America, 114, 186–189. http://doi.org/10.1073/PNAS.1620081114
Eakin, H., Lemos, M.C., 2010, Institutions and change: The challenge of building adaptive capacity in Latin America: Global Environmental Change, 20, 1–3. http://doi.org/10.1016/j.gloenvcha.2009.08.002
Eakin, H., Luers, A.L., 2006, Assessing the vulnerability of social-environmental systems: Annual Review of Environment and Resources, 31, 365–394. http://doi.org/10.1146/annurev.energy.30.050504.144352
Escolero, O., Kralisch, S., Martínez, S.E., Perevochtchikova, M., 2016, Diagnóstico y análisis de los factores que influyen en la vulnerabilidad de las fuentes de abastecimiento de agua potable a la Ciudad de México, México: Boletín de la Sociedad Geológica Mexicana, 68(3), 409–427. https://doi.org/10.18268/bsgm2016v68n3a3
Espinosa Osnaya, K., 2017, La problemática del agua en Magdalena Petlalco, pueblo de Tlalpan, in Canabal Cristiani, B. and Narchi N., N.E. (eds.), El agua en los pueblos del sur de la Ciudad de México: CDMX, Universidad Autónoma Metropolitana Unidad Xochimilco, 193–199.
Esquivel-Hernández, G., Sánchez-Murillo, R., Birkel, C., Boll, J., 2018, Climate and water conflicts coevolution from tropical development and hydro-climatic perspectives: A case study of Costa Rica: Journal of the American Water Resources Association, 54, 451–470. http://doi.org/10.1111/1752-1688.12617
Ezcurra, E., 1996, De las chinampas a la megalópolis. El medio ambiente en la Cuenca de México: México, D.F., Fondo de Cultura Económica, 85 p.
Fondo para la Comunicación y la Educación Ambiental, Centro Mexicano de Derecho Ambiental, y Presencia Ciudadana Mexicana, 2006, El agua en México: lo que todas y todos debemos saber: Ciudad de México, FEA,CEMDA, Presencia Ciudadana Mexicana, 93 p.
Ford, J.D., Pearce, T., Mcdowell, G., Berrang-Ford, L., Sayles, J.S., Belfer, E., 2018, Vulnerability and its discontents: the past, present, and future of climate change vulnerability research: Climatic Change, 151, 189–203. http://doi.org/10.1007/s10584-018-2304-1
García Mata, L., 2014, El agua en los pueblos del sur de la ciudad de México, in Canabal Cristiani, B., Narchi N., N. (eds.), El agua en los pueblos del sur de la Ciudad de México: CDMX, México, Universidad Autónoma Metropolitana Unidad Xochimilco, 201–205.
Gobierno de la Ciudad de México, 2020, Datos de todos los casos asociados de COVID-19 en Ciudad de México. CDMX, Datos abiertos sobre salud pública. https://datos.cdmx.gob.mx/group/covid-19 (accessed June 2020).
Gobierno de la Ciudad de México, 2013, La Crisis del agua en la Ciudad de México, Retos y Soluciones: México, Gobierno de la Ciudad de México, Red del Agua, UNAM, SACMEX.
Gobierno de México, 2019, Programa nacional de financiamiento al microempresario (PRONAFIM): México, Secretaría de Economía. https://www.gob.mx/pronafim/que-hacemos (accessed September 2021).
Gómez-Valdez, M.I., Palerm-Viqueira, J., 2015, Abastecimiento de agua potable por pipas en el Valle de Texcoco, México: Agricultura Sociedad y Desarrollo, 12, 567–586. http://doi.org/10.22231/asyd.v12i4.246
González Cebrián, P., 2018, ¿Cómo afecta el aumento demográfico a los recursos hídricos?: España, iAgua. https://www.iagua.es/blogs/pablo-gonzalez-cebrian/como-afecta-aumento-demografico-recursos-hidricos (accessed September 2021).
González Tánago, I., Urquijo, J., Blauhut, V., Villarroya, F., de Stefano, L., 2016, Learning from experience: a systematic review of assessments of vulnerability to drought: Natural Hazards, 80, 951–973. http://doi.org/10.1007/s11069-015-2006-1
Hamouda, M.A., Nour El-Din, M.M., Moursy, F.I., 2009, Vulnerability assessment of water resources systems in the Eastern Nile Basin: Water Resources Management, 23, 2697–2725. http://doi.org/10.1007/s11269-009-9404-7
Hidroconta, 2020, Arabia Saudí monitoriza la extracción de agua : España, Hidroconta. https://hidroconta.com/arabia-saudi-hidroconta/ (accessed January 2021).
Huaquisto Cáceres, S., Chambilla Flores, I.G., 2019, Análisis del consumo de agua potable en el centro poblado de Salcedo, Puno: Investigación and Desarrollo, 19(1), 133–144. http://doi.org/10.23881/idupbo.019.1-9i
INEGI, 2014, Directorio Nacional de Unidades Económicas. DENUE: Censos Económicos 2014: México, INEGI.
INEGI, 2015, Número de habitantes. Ciudad de México:, http://cuentame.inegi.org.mx/monografias/informacion/df/poblacion/ (accessed August 2020).
INEGI,2020, Movimientos migratorios. Distrito Federal: México, INEGI. http://cuentame.inegi.org.mx/monografias/informacion/df/poblacion/m_migratorios.aspx?tema=me&e=09 (accessed September 2020).
Instituto Nacional para el Federalismo y el Desarrollo Municipal, 2017, Crecimiento urbano y sostenibilidad: retos y desafíos para los #MunicipiosdeMéxico: México, INAFED. https://www.gob.mx/inafed/articulos/crecimiento-urbano-y-sostenibilidad-retos-y-desafios-para-los-municipiosdemexico (accessed September 2021).
Iyengar, N.S., Sudarshan, P., 1982, A method of classifying regions from multivariate data: Economic and Political Weekly, 17, 2047–2052.
Jiménez Cisneros, B., Gutiérrez Rivas, R., Marañón Pimentel, B., González Reynoso, A., 2011, Evaluación de la Política de Acceso al Agua Potable en el Distrito Federal: Ciudad de México, Programa Universitario de estudios sobre la Ciudad, UNAM., 261 p. http://www.libros.unam.mx/digital/v5/45.pdf
Jiménez, M., Pérez-Belmont, P., Schewenius, M., Lerner, A.M., Mazari-Hiriart, M., 2020, Assessing the historical adaptive cycles of an urban social-ecological system and its potential future resilience: the case of Xochimilco, Mexico City: Regional Environmental Change, 20, 7. http://doi.org/10.1007/s10113-020-01587-9
Lara, R., 2019, El agua que da vida... y cerveza: México, Expansión. https://expansion.mx/empresas/2019/03/22/dia-del-agua-cerveceras-reducen-consumo-agua-mexico (accessed January 2021).
Magallanes, J., 2016, La CDMX se está despoblando ante altos costos de vivienda: Seduvi: México, MVS Noticias. https://mvsnoticias.com/noticias/capital/la-cdmx-se-esta-despoblando-ante-altos-costos-de-vivienda-seduvi-800 (accessed September 2021).
Martínez, S., Perevochtchikova, M., Escolero, O., Kralisch, S., 2009, Vulnerabilidad de las fuentes de abastecimiento de agua potable de la Ciudad de México en el contexto de cambio climático, en VII Encuentro Participación de la Mujer en la Ciencia: México, Centro de Investigación en Óptica A.C., 6p.
Martínez, S., Kralisch, S., Escolero, O., Perevochtchikova, M., 2015, Vulnerability of Mexico city’s water supply sources in the context of climate change: Journal of Water and Climate Change, 6, 518–533. http://doi.org/10.2166/wcc.2015.083
Mazari Hiriart, M., Noyola Robles, A., 2019, La problemática del agua en México, in Merino Pérez, L. (ed.), Crisis ambiental en México. Ruta para el cambio: Ciudad de México, UNAM, 27–52.
Mazari-Hiriart, M., Cruz-bello, G., Bojórquez-tapia, L.A., Juárez-Marusich, L., Alcantar-lópez, G., Marín, L.E., Soto-Galera, E., 2006, Groundwater vulnerability assessment for organic compounds: Fuzzy multicriteria approach for Mexico City: Environmental Management, 37, 410–421. http://doi.org/10.1007/s00267-005-0059-8
Mazari-Hiriart, M., Tapia-Palacios, M.A., Zarco-Arista, A.E., Espinosa-García, A.C., 2019, Challenges and opportunities on urban water quality in Mexico City: Frontiers in Environmental Science, 7, 169. http://doi.org/10.3389/fenvs.2019.00169
Monterroso, A., Conde, C., Gay, C., Gómez, D., López, J., 2014, Two methods to assess vulnerability to climate change in the Mexican agricultural sector: Mitigation and Adaptation Strategies for Global Change, 19, 445–461. http://doi.org/10.1007/s11027-012-9442-y
Naciones Unidas, 2012, Cómo desarrollar ciudades más resilientes. Un Manual para líderes de los gobiernos locales: Ginebra, ONU, 103p.
Navarro Rodríguez, S.R., Larrubia Vargas, R., 2006, Indicadores para medir situaciones de vulnerabilidad social. Propuesta realizada en el marco de un proyecto europeo: Baética Estudios de Arte, Geografía e Historia, 1, 485–506. http://doi.org/10.24310/baetica.2006.v1i28.270
OMS, 2019, La cantidad de agua domiciliaria, el nivel del servicio y la salud: Ginebra, OMS, 39p.
Ordoñez, J., 2019, CDMX: ¿Cuánta agua consume un mexicano al día? (Milenio):México, portal Agua.org.mx. https://agua.org.mx/cdmx-cuanta-agua-consume-un-mexicano-al-dia-milenio/ (accessed January 2021).
Ortega-Gaucin, D., Velasco, I., de la Cruz, J., Castellano, H. V., 2016, Metodología para calcular índices de vulnerabilidad ante la sequía en los Organismos de Cuenca en México, in Congreso Latinoamericano de Hidráulica, Lima, Perú, 10p.
Pacheco-Vega, R., 2015, Agua embotellada en México: de la privatización del suministro a la mercantilización de los recursos hídricos: Espiral (Guadalajara): Estudios sobre Estado y Sociedad, 22, 221–263.
Padowski, J.C., Jawitz, J.W., 2012, Water availability and vulnerability of 225 large cities in the United States: Water Resources Research, 48(12),1–16. http://doi.org/10.1029/2012WR012335
Perevochtchikova, M., 2013, Retos de la información del agua en México para una mejor gestión: Realidad, datos y espacio: Revista Internacional de Estadística y Geografía, 4(1), 42–57.
Perló Cohen, M., González Reynoso, A., 2005, ¿Guerra por el agua en el Valle de México? Estudio sobre las relaciones hidráulicas entre el Distrito Federal y el Estado de México: México, UNAM; Fundación Friedrich Ebert, 143 p.
Perló-Cohen, M., González Reynoso, A.E., 2006, Del agua amenazante al agua amenazada. Cambios en las representaciones sociales de los problemas del agua en el Valle de México, in Perló-Cohen, M. (ed.), Más allá del Cambio Climático: México, UNAM, 47–64.
Procuraduría Ambiental y del Ordenamiento Territorial, 2010, Estudio sobre el ordenamiento, control y tratamiento integral de los Asentamientos Humanos Irregulares, ubicados en suelo de conservación del Distrito Federal: México, D.F., Procuraduría Ambiental y del Ordenamiento Territorial del Distrito Federal, 54 p.
QGIS, 2020, Development Team. QGIS Geographic Information System.
Quintero, J., 2020, El agua, parte del problema, pero también de la solución ante el cambio climático: Noticias ONU.https://news.un.org/es/story/2020/03/1471492 (accessed January 2021).
Revollo-Fernández, D.A., Rodríguez-Tapia, L., 2021, Unequal Access to Water and Its Affordability for Households in Mexico: Journal of Poverty, 1–16. http://doi.org/10.1080/10875549.2021.1955807
Revollo-Fernández, D.A., Rodríguez-Tapia, L., Morales-Novelo, J.A., 2020, Economic value of water in the manufacturing industry located in the Valley of Mexico Basin, Mexico: Water Resources and Economics, 30, 100138. http://doi.org/10.1016/j.wre.2019.01.004
Rolland, L., Vega Cárdenas, Y., 2010, La gestión del agua en México: Polis, 6, 155–188.
Romero Lankao, P., Qin, H., 2011, Conceptualizing urban vulnerability to global climate and environmental change: Current Opinion in Environmental Sustainability, 3, 142–149. http://doi.org/10.1016/J.COSUST.2010.12.016
Roudi-Fahimi, F., Creel, L., Mark de Souza, R., 2002, Finding the balance: Population and water scarcity in the Middle East and North Africa – Population Reference Bureau: Kenya, PRB.
Salas Pérez, C., Coy Castro, D., Acuña Ramírez, K., Páez Cuervo, L., Upegui, E., 2019, Crecimiento urbano e impermeabilización del suelo alrededor de la Reserva Forestal Thomas van der Hammen, en la ciudad de Bogotá: Ambiente y Desarrollo, 23, 1–16. http://doi.org/10.11144/javeriana.ayd23-44.cuis
Sánchez Vargas, A., Estrada Porrua, F., Gay García, C., 2012, El cambio climático y la pobreza en el Distrito Federal: México, UNAM, 25p.
Sanctuary, M., Tropp, H., Haller, L., 2005, Making water a part of economic development: The economic benefits of improved water management and services: Stockholm, Sweden, SIWI, 272 p.
SEAPAL Vallarta, 2016, Fundamental participación ciudadana para reparación de fugas - SEAPAL Puerto Vallarta:México, SEAPEL. http://www.seapal.gob.mx/fundamental-participacion-ciudadana-reparacion-fugas/ (accessed January 2021).
Secretaría de Gobernación, and Centro Nacional de Prevención de Desastres, 2001, Diagnóstico de peligros e identificación de riesgos de desastres en México, en Zepeda Ramos, O. y González Martínez, S. (Eds.): México, CENAPRED, 225p.
Sena, J.A., Freitas, M.A. v., de Berrêdo, D., Fernandes, L.C., 2012, Evaluation of vulnerability to extreme climatic events in the Brazilian Amazonia: Methodological proposal to the Rio Acre Basin: Water Resources Management, 26, 4553–4568. http://doi.org/10.1007/s11269-012-0166-2
Sheinbaum Pardo, C., 2008, Problemática ambiental de la Ciudad de México: México, Limusa, 309 p.
Sistema de Aguas de la Ciudad de México, 2012, Programa de Gestión Integral de los Recursos Hídricos, Visión 20 años: México, Secretaría del Medio Ambiente, UNAM, 140p.
Solano-Rojas, D., Cabral-Cano, E., Hernández-Espriú, A., Wdowinski, S., DeMets, C., Salazar-Tlaczani, L., Falorni, G., Bohane, A., 2015, La relación de subsidencia del terreno InSAR-GPS y el abatimiento del nivel estático en pozos de la zona Metropolitana de la Ciudad de México: Boletín de la Sociedad Geológica Mexicana, 67, 273–28. http://doi.org/10.18268/bsgm2015v67n2a10
The Rockefeller Foundation, and Arup, 2014, City resilience framework: Ove Arup and partners international limited, 21 p.
Turner, B. L., Kasperson, R. E., Matson, P. A., McCarthy, J. J., Corell, R. W., Christensen, L., Eckley, N., Kasperson, J. X., Luers, A., Martello, M.L., Polsky, C., Pulsipher, A., Schiller, A., 2003, A framework for vulnerability analysis in sustainability science: Proceedings of the National Academy of Sciences of the United States of America, 100(14), 6. https://doi.org/10.1073/pnas.1231335100
USGS, 2021, USGS Water Data for the Nation. https://waterdata.usgs.gov/nwis (accessed January 2021).
Velasco, G., Becerra, M., Vazquez, I., Skwierinski, A., Haro, M., Ortega, M., 2014, Estrategia Local de Acción Climática: Ciudad de México 2014-2020: México, Centro Mario Molina para Estudios Estratégicos sobre Energía y Medio Ambiente, A.C., 152 p.
Velasco Gutiérrez, M., 2014, Vulnerabilidad del sector hídrico por efectos del cambio climático en México:México, UNAM, Tesis de Licenciatura, 71 p.
Velasco Rodríguez, G., Becerra Delgado, M. de L., Velázquez Ramírez, I., Skwierinski Durán, A., Haro González, M.E., Ortega Ramírez, M., 2014, Programa de acción climática: México, Gobierno de la Ciudad de México, Secretaría del Medio Ambiente de la Ciudad de México, Centro Mario Molina, 388p.
Velasco Ruíz, J., 2020, El abastecimiento de agua en algunas zonas de Castilla y León no es apta para el consumo humano: España, GNdiario. https://www.gndiario.com/abastecimiento-agua-cyl (accessed January 2021).
Vera Pérez, M., López Blanco, J., 2010, Evaluación de amenazas por inundaciones en el centro de México: el caso de Iztapalapa, Distrito Federal (1998–2005): Investigaciones Geográficas, 73, 22–40.
Wakode, H.B., Baier, K., Jha, R., Azzam, R., 2018, Impact of urbanization on groundwater recharge and urban water balance for the city of Hyderabad, India: International Soil and Water Conservation Research, 6, 51–62. http://doi.org/10.1016/j.iswcr.2017.10.003
Zambrano, L., 2017, Ríos y lagos en ciudades utópicas: México, Nexos. https://labrujula.nexos.com.mx/?p=1266 (accessed January 2021).
Appendix A. Data collection and generation
a) Urbanization
To calculate the urbanization are we processed Landsat satellite images in SAGA GIS (Conrad et al., 2015). These were obtained from the Google Earth Engine platform (Gorelick et al., 2017) for the years 2005 (Landsat 7), 2010 (Landsat 7), and 2015 (Landsat 8). The Landsat images were processed to cover the extension of Mexico City. We used the combination of bands 7-3-1 on Landsat 7 and 7-6-4 on Landsat 8 to distinguish urban areas from non-urban ones. To classify urban and non-urban areas from the satellite images, we used the clusters algorithm based on K-Means in SAGA GIS (Conrad et al., 2015).
Once we obtained the classified images, we reclassified them to determine the pixels corresponding to the urban and non-urban areas. The fifth step entailed getting confusion matrices from the reclassified images, which contained the values of the relative change of one raster compared to another, based on the difference in the number of pixels. We obtained the area in km2 considering the pixel size of the Landsat images from equation 1:
 |
Where U is urbanization; NUP is the number of pixels; and1 is in Km2.
Finally, the maps were done in Qgis (QGIS Development Team, 2020) and edited in Adobe Photoshop CS6©.
b) Number of inhabitants
We obtained the number of inhabitants for each of the 16 Municipalities in Mexico City from the censuses and intercensal surveys from the Platform of the Instituto Nacional de Estadística y Geografía (INEGI) (National Institute of Statistics and Geography (INEGI, 2015)).
c) Economic Units
From the Directorio Nacional de Unidades Económicas (DENUE) (National Directory of Economic Units (INEGI, 2014), we obtained the economic units of each Municipality for the years 2010 and 2015. Due to the lack of data for 2005, we used the data from 2010. Of course, the above impacted the results. However, we observed that before 2014 the general variance for all Municipalities was not significant. The data used is a proxy that allows continuing with the assessment.
d) Water leaks and water shortages
The data for water leak and water shortage reports from SACMEX through the Plataforma Nacional de Transparencia (National Transparency Platform; (Gobierno Federal, n.d)).
e) Water Quality
Due to the lack of complete official water quality records documented in each Municipality, we used the reports made by citizens of poor water quality. The information was obtained from SACMEX through the Sistema de Solicitudes de Información de la Ciudad de México platform (INFOMEX; (Gobierno Federal, 2007)).
f) Sewage treatment
Wastewater is classified as municipal and industrial, where the former is operated by the municipal, urban and rural sewage systems, while the latter is discharged directly to the receiving bodies (Gobierno de la República et al., 2014). We obtained the data for this indicator from the Platform of the Sistema Nacional de Información del Agua (SINA; CONAGUA, 2015a) (National Water Information System (SINA)).
g) Water availability
The data for the water availability indicator were requested from the Sistema de Aguas de la Ciudad de México (SACMEX) through the Sistema de Solicitudes de Información de la Ciudad de México (INFOMEX; (Gobierno Federal, 2007)) (Mexico City Information Request System). We received the data in two ways: 1) drinking water expenditure received by each Municipality in l/s from internal sources (wells) and 2) drinking water expenditure received by Mexico City from external sources (e.g., Lerma-Cutzamala System).
The challenge was to calculate the amount of water that each Municipality receives from internal sources and external sources since these last data were available for the entire City.
We calculate the latter at the Municipality level based on the difference between the data published on the SEDEMA website (SEDEMA, 2016) based on information from SACMEX and the data we obtained through INFOMEX from equation 2, the percentage of water from external sources (wfes; Sistema Cutzamala, Sistema Lerma, PAI and Chiconautla) that supplies each Municipality was estimated.
Where %wfes is the percentage of water from external sources; SF is SEDEMA flow; IF is Infomex flow; Σ (SF-IF) is the sum of both differences.
To calculate the flow of water that each city hall receives from external sources, the percentage obtained was multiplied by the amount of water that Mexico City gets from external sources.
h)Gross Domestic Product
El Consejo de Evaluación del Desarrollo Social del Distrito Federal la Ciudad de México (The Council for the Evaluation of Social Development of the Federal District of Mexico City) divides poverty into four categories according to their level: high, medium, medium-low and low. This information partially coincides with the Gross Domestic Product (GDP) generated by each Municipality, whose data we obtained from the Information Request System of Mexico City (INFOMEX). In this case, we received the requested information for the years 2004, 2009, and 2014.
Since we did not find GDP data for those years, we used 2004, 2009, and 2014. Although GDP does vary from year to year, even quarterly, this situation is not considered to significantly affect the study since the data suggested that the variation from year to year was slight and generally positive. In addition to the fact that the trend for Mexico City was positive with a slope that had been maintained over time. This situation anticipates any possible bias in the comparison.
Appendix B. Normalization
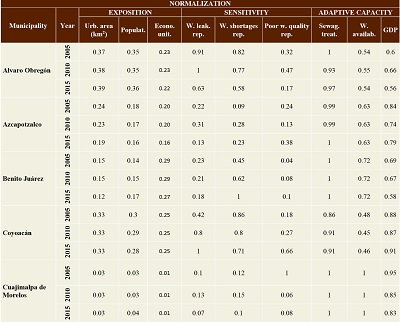 |
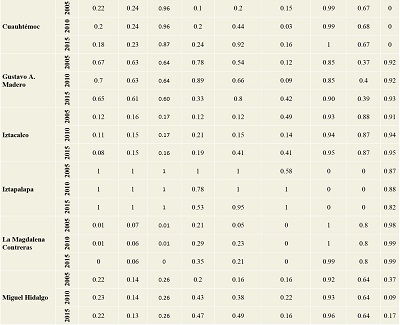 |
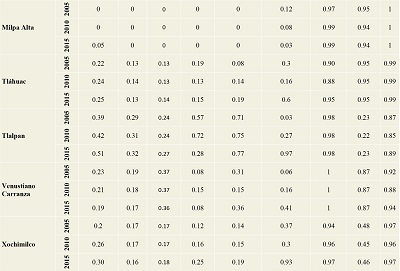 |
Appendix C. Weight allocations
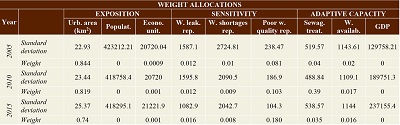 |
Appendix D. Vulnerability Index Calculation.
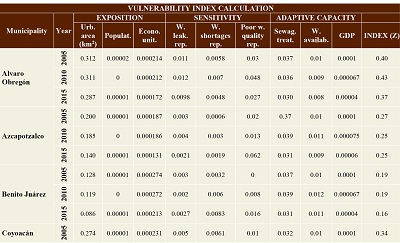 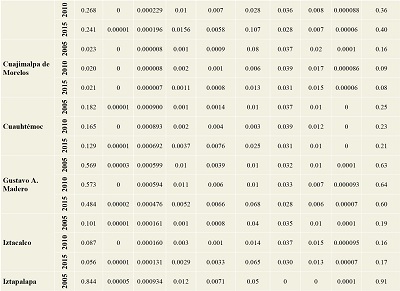 |
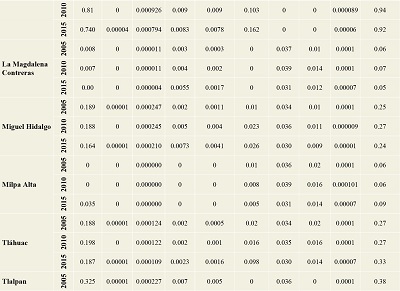 |
Appendix E. Vulnerability Index classification.
|
|
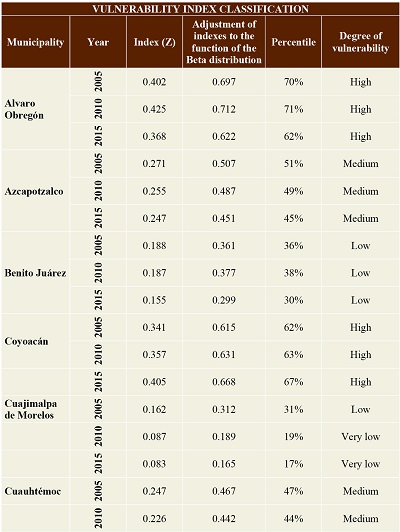
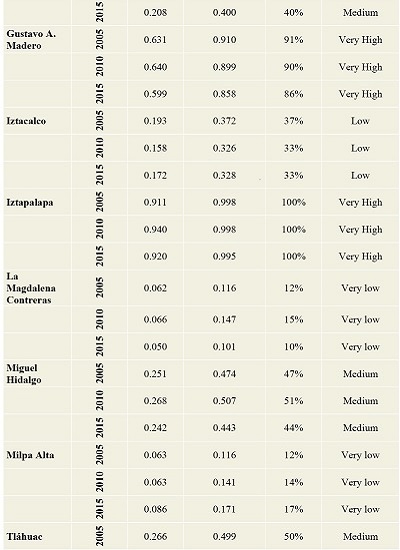
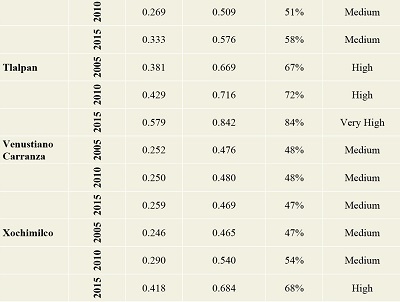
Appendix F. Methodology to obtain water endowment and rainwater harvesting data.
Water endowment refers to the amount of water that corresponds to each inhabitant and can indicate inequity in water distribution. To compare the vulnerability classification and water endowment, we estimated this latter from equation 3.
| |
Where WE is water endowment; ADW is the availability of drinking water in liters per second; SPD is seconds per day; and I is inhabitants.
Since the data obtained on water availability were limited to internal supply sources by Municipality, and that the water expenditure from external sources was obtained for the entire City and not disaggregated by Municipality, we calculated it from the difference between the data obtained from SACMEX (availability of internal sources) through the Transparency Portal, and data from the SEDEMA webpage (2016) where availability was found depending on internal and external sources.
We calculated the availability of water for the years 2005, 2010, and 2015 from internal and external sources from equation 4.
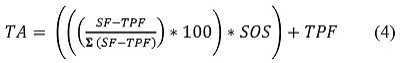 |
Where TA is total availability; SF is the water flow of SEDEMA webpage; TPF is the water flow from internal sources obtained through the Transparency Portal; and SOS is the supply to the entire City from outside sources.
To compare the vulnerability classifications and the rainwater harvesting systems, we obtained data for this latter through interviews with Isla Urbana (Urban Island).
Manuscript received: August 24, 2021
Corrected manuscript received: September 28, 2021
Manuscript accepted: October 6, 2021
Peer Reviewing under the responsibility of Universidad Nacional Autónoma de México.
This is an open access article under the CC BY-NC-SA license(https://creativecommons.org/licenses/by-nc-sa/4.0/)